
2009-2010 Influenza Season Week 44 ending November 7, 2009
All data are preliminary and may change as more reports are received.
Synopsis:
During week 44 (November 1-7, 2009), influenza activity decreased slightly in the U.S.
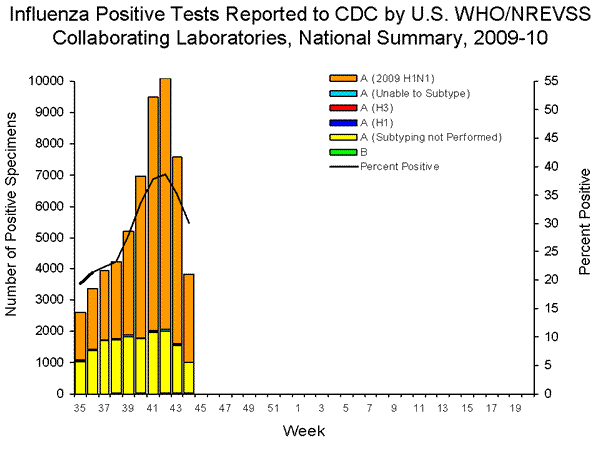
- 3,834 (30.1%) specimens tested by U.S. World Health Organization (WHO) and National Respiratory and Enteric Virus Surveillance System (NREVSS) collaborating laboratories and reported to CDC/Influenza Division were positive for influenza.
- All subtyped influenza A viruses being reported to CDC were 2009 influenza A (H1N1) viruses.
- The proportion of deaths attributed to pneumonia and influenza (P&I) was above the epidemic threshold for the sixth consecutive week.
- Thirty-five influenza-associated pediatric deaths were reported. Twenty-six of these deaths were associated with 2009 influenza A (H1N1) virus infection, eight were associated with an influenza A virus for which the subtype was undetermined, and one was associated with an influenza B virus infection.
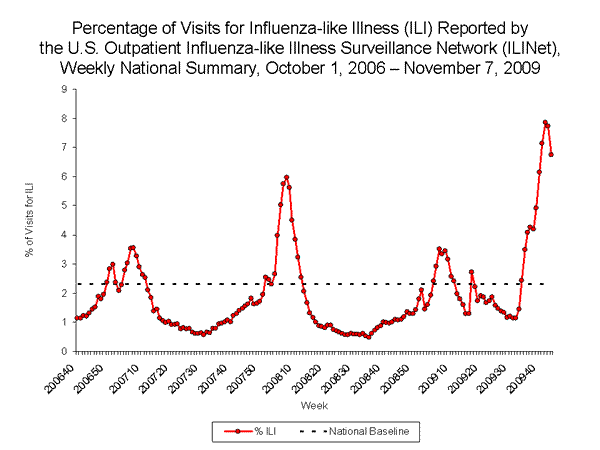
- The proportion of outpatient visits for influenza-like illness (ILI) was 6.7% which is above the national baseline of 2.3%. All 10 regions reported ILI above region-specific baseline levels.
- Forty-six states reported geographically widespread influenza activity, Puerto Rico and four states reported regional influenza activity, the District of Columbia reported local influenza activity, Guam reported sporadic influenza activity, and the U.S. Virgin Islands did not report.
National and Regional Summary of Select Surveillance Components
B
19 (0.5%)
During week 44, influenza B viruses co-circulated at low levels with 2009 influenza A (H1N1) viruses. All subtyped influenza A viruses reported to CDC this week were 2009 influenza A (H1N1) viruses.
View WHO-NREVSS Regional Bar Charts| View Chart Data | View Full Screen
Pneumonia and Influenza Hospitalization and Death Tracking:
This new system was implemented on August 30, 2009, and replaces the weekly report of laboratory confirmed 2009 H1N1-related hospitalizations and deaths that began in April 2009. Jurisdictions can now report to CDC counts of hospitalizations and deaths resulting from all types or subtypes of influenza, not just those from 2009 H1N1 influenza virus. To allow jurisdictions to implement the new case definition, counts were reset to zero on August 30, 2009. From August 30 – November 7, 2009, 22,364 laboratory-confirmed influenza associated hospitalizations and 877 laboratory-confirmed influenza associated deaths were reported to CDC. CDC will continue to use its traditional surveillance systems to track the progress of the 2009-10 influenza season.

Antigenic Characterization:
CDC has antigenically characterized one seasonal influenza A (H1N1), two influenza A (H3N2) and 320 2009 influenza A (H1N1) viruses collected since September 1, 2009.
One seasonal influenza A (H1N1) virus was tested and is related to the influenza A (H1N1) component of the 2009-10 Northern Hemisphere influenza vaccine (A/Brisbane/59/2007).
Both influenza A (H3N2) viruses tested showed reduced titers with antisera produced against A/Brisbane/10/2007, the 2009-2010 Northern Hemisphere influenza A (H3N2) vaccine component, and were antigenically related to A/Perth/16/2009, the WHO recommended influenza A (H3N2) component of the 2010 Southern Hemisphere vaccine formulation.
Three hundred and nineteen (99.7%) of 320 2009 influenza A (H1N1) viruses tested are related to the A/California/07/2009 (H1N1) reference virus selected by WHO as the 2009 H1N1 vaccine virus and one virus (0.3%) tested showed reduced titers with antisera produced against A/California/07/2009.
Annual influenza vaccination is expected to provide the best protection against those virus strains that are related to the vaccine strains, but limited to no protection may be expected when the vaccine and circulating virus strains are so different as to be from different lineages. Antigenic characterization of 2009 influenza A(H1N1) viruses indicates that these viruses are only distantly related antigenically and genetically to seasonal influenza A(H1N1) viruses, suggesting that little to no protection would be expected from vaccination with seasonal influenza vaccine. It is too early in the influenza season to determine if seasonal influenza viruses will circulate widely or how well the vaccine and circulating strains will match.
Antiviral Resistance:
Since September 1, 2009, 315 2009 influenza A (H1N1) virus isolates have been tested for resistance to the neuraminidase inhibitors (oseltamivir and zanamivir), and 761 2009 influenza A (H1N1) original clinical samples were tested for a single known mutation in the virus that confers oseltamivir resistance. In addition, one influenza A (H3N2) and 152 2009 influenza A (H1N1) virus isolates have been tested for resistance to the adamantanes (amantadine and rimantadine). Additional laboratories perform antiviral testing and report their results to CDC. The results of antiviral resistance testing performed on these viruses are summarized in the table below.
Antiviral Resistance Testing Results on Samples Collected (http://www.cdc.gov/mmwr/preview/mmwrhtml/mm5832a3.htm).
Pneumonia and Influenza (P&I) Mortality Surveillance
During week 44, 7.7% of all deaths reported through the 122-Cities Mortality Reporting System were due to P&I. This percentage was above the epidemic threshold of 6.8% for week 44. Including week 44, P&I mortality has been above threshold for six consecutive weeks.
Influenza-Associated Pediatric Mortality
Thirty-five influenza-associated pediatric deaths were reported to CDC during week 44 (Alabama, Arizona, Arkansas [2], California [8], Delaware, Georgia, Illinois, Michigan [2], Missouri, New Jersey, Ohio [2], Oklahoma [3], Tennessee [2], Texas [6], Utah, Virginia, and Washington). Twenty-six of these deaths were associated with 2009 influenza A (H1N1) virus infection, eight were associated with an influenza A virus for which the subtype is undetermined, and one was associated with an influenza B virus infection. These deaths occurred between March 15 and November 7, 2009.
Three deaths reported during week 44, including the death associated with influenza B virus infection, occurred during the 2008-09 season, bringing the total number of reported pediatric deaths occurring during that season to 127.
Since August 30, 2009, CDC has received 117 reports of influenza-associated pediatric deaths that occurred during the current influenza season (18 deaths in children less than 2 years old, 12 deaths in children 2-4 years old, 41 deaths in children 5-11 years old, and 46 deaths in children 12-17 years old). Ninety-eight (84%)of the 117 deaths were due to 2009 influenza A (H1N1) virus infections, and the remaining 19 were associated with influenza A virus for which the subtype is undetermined. A total of 156 deaths in children associated with 2009 influenza A (H1N1) virus infection have been reported to CDC.
Among the 117 deaths in children, 65 children had specimens collected for bacterial culture from normally sterile sites and 18 (27.7%) of the 65 were positive; Staphylococcus aureus was identified in eight (44.4%) of the 18 children. One S. aureus isolate was sensitive to methicillin, six were methicillin resistant, and one did not have sensitivity testing performed. Thirteen (72.2%) of the 18 children with bacterial coinfections were five years of age or older, and five (27.8%) of the 18 children were 12 years of age or older.

Influenza-Associated Hospitalizations
Laboratory-confirmed influenza-associated hospitalizations are monitored using a population-based surveillance network that includes the 10 Emerging Infections Program (EIP) sites (CA, CO, CT, GA, MD, MN, NM, NY, OR and TN) and 6 new sites (IA, ID, MI, ND, OK and SD).
During September 1, 2009 – November 7, 2009, the following preliminary laboratory-confirmed overall influenza associated hospitalization rates were reported by EIP and the new sites (rates include influenza A, influenza B, and 2009 influenza A (H1N1)):
Rates [EIP (new sites)] for children aged 0-4 years and 5-17 years were 4.0 (8.1) and 2.0 (3.1) per 10,000, respectively. Rates [EIP (new sites)] for adults aged 18-49 years, 50-64 years, and ≥ 65 years were 1.5 (1.4), 1.7 (1.4) and 1.4 (1.3) per 10,000, respectively.
.
Outpatient Illness Surveillance:
Nationwide during week 44, 6.7% of patient visits reported through the U.S. Outpatient Influenza-like Illness Surveillance Network (ILINet) were due to influenza-like illness (ILI). This percentage is above the national baseline of 2.3%.
View ILINet Regional Charts | View Chart Data | View Full Screen
On a regional level, the percentage of outpatient visits for ILI ranged from 4.2% to 8.8% during week 44, and decreased in nine of the 10 surveillance regions compared to the previous week. All 10 regions reported a proportion of outpatient visits for ILI above their region-specific baseline levels.
Geographic Spread of Influenza as Assessed by State and Territorial Epidemiologists:
The influenza activity reported by state and territorial epidemiologists indicates geographic spread of both seasonal influenza and 2009 influenza A (H1N1) viruses and does not measure the severity of influenza activity.
- During week 44, the following influenza activity was reported:
- Widespread influenza activity was reported by 46 states (Alabama, Alaska, Arizona, Arkansas, California, Colorado, Connecticut, Delaware, Florida, Georgia, Idaho, Illinois, Indiana, Iowa, Kansas, Kentucky, Louisiana, Maine, Maryland, Massachusetts, Michigan, Minnesota, Missouri, Montana, Nevada, New Hampshire, New Jersey, New Mexico, New York, North Carolina, North Dakota, Ohio, Oklahoma, Oregon, Pennsylvania, Rhode Island, South Carolina, South Dakota, Tennessee, Utah, Vermont, Virginia, Washington, West Virginia, Wisconsin, and Wyoming).
- Regional influenza activity was reported by Puerto Rico and four states (Hawaii, Mississippi, Nebraska, and Texas).
- Local influenza activity was reported by the District of Columbia.
- Sporadic influenza activity was reported by Guam.
- The U.S. Virgin Islands did not report.
Click on the following for more details on these CDC studies: Flu Activity data in XML Format | View Full Screen
2 comments:
H1N1 really frightened us even today. We can be safe by just monitoring our own health. ELISA test kits could be so helpful in determining if we are positive with H1N1.
Saved as a favorite, I love your website!
Post a Comment