Thursday, May 14, 2020

May 14: 87,937 COVID-19 cases in Illinois


In response to the COVID-19 pandemic, Gov. JB Pritzker has ordered Illinois residents to stay at home. Executive Order No. 10 requires all residents to stay home, with exceptions for essential needs or business activities. Gatherings of 10 people or more are prohibited. The order extends through May 30, 2020.
COVID-19
Positive (Confirmed)
87,937   +3,239
Deaths
3,928  +136
Total Tests Performed*
512,037   +22,678
Total Cases
(87,937  5-14-2020) (84,698  5-13-2020) (83,021  5-12-2020)(79,007  5-11-2020) (77,741 5-10-2020)  (76,085  5-9-2020)(73,760  5-8-2020)(70,873 5-7-2020)(68,232  5-6-2020) (65,962  5-5-2020)  (63,840  5-4-2020) (61,499 5-3-2020) (58,505  5-2-2020)  56,055 5-1-2020) (52,918  4-30-2020) (50,355  4-29-3030) (48,102 4-28-2020) (45,883  4-27-2020) (43,903  4-26-2020) ( 41,777  4-25-2020) (39,658  4-24-2020)  (36,934 4-23-2020)  (35,108 4-22-2020)(33,059  4-21-2020) (31,508  4-20-2020) (30,357 4-19-2020)  (29,160  4-18-2020)  (27,575  4-17-2020) (25,733  4-16-2020)  (24,593 4-15-2020)  (23,247 4-14-2020)  (22,025 4-13-2020)  (20,852 4-12-2020) (19,180 4-11-2020 ) (17,887 4-10-2020) (16,422 4-9-2020) (15,078 4-8-2020) (13,549 4-7-2020) (12,262 4-6-2020) (11,256 4-5-2020) (10,357 4/4/2020) (8,904-- 4/3/2020) (7,695-- 4/2/2020)   (6,980-- 4/1/2020) (5,994-- 3/31/2020)  (5,05--7 3/30/2020) (4,596-- 3/29/2020)

Deaths

Total Persons Tested*
(512,037  5-14-2020)  (489,359  5-13-2020)(471,691 5-12-2020) (442,425  5-11-2020) (429,984  5-10-2020) (416,331 5-9-2020)  (399,714 5-8-2020)  (379,033 5-7-2020)(361,260 5-6-2020) (346,286 5-5-20200 (333,147  5-4-2020) (319,313  5-3-2020) (299,892 5-2-2020)  (284,688  5-1-2020) (269,867 4-30-2020) (256,667  4-29-2020) (242,189  4-28-2020) (227,628  4-27-2020) (214,952 4-26-2020) (201,617 4-25-2020) (186,219  4-24-2020)(173,316 4-23-2020) (164,346 4-22-2020)  (154,997  4-21-2020) (148,358 4-20-2020) (143,318 4-19-2020)  (137,404  4-18-2020) (130,163  4-17-2020)  (122,589  4-16-2020)  (116,929 4-15-2020) (110,616 4-14-2020)  (105,768 4-13-2020) (100,735 4-12-2020) (92,779 4-11-2020) (87,527 4-10-2020) (86,857 4-9-2020) (75,066 4-8-2020) (68,732 4-7-2020) (62,942 4-6-2020) (58,983 4-5-2020) (53,581—4-4-2020)  (48,048-- 4-3-2020) (43,653-- 4/2/2020) (40,384-- 4/1/2020) (35,225-- 3-31-2020) (30,446-- 3/30/2020)  (27,762-- 3/29/2020)

*Total number of people reported electronically for testing of COVID-19 at IDPH, commercial or hospital laboratories. Deaths are included in the number of positive cases
All numbers displayed are provisional and subject to change.

Information to be updated daily.

Above is from: http://www.dph.illinois.gov/covid19/covid19-statistics

*****************************************************************************************************************************

Home


PROJECTIONS from:  http://www.healthdata.org/research-article/forecasting-covid-19-impact-hospital-bed-days-icu-days-ventilator-days-and-deaths Now being updated three times per week.

HUGE INCREASE IN PROJECTED DEATHS    For discussion go to: http://boonecountywatchdog.blogspot.com/2020/05/ihme-model-nearly-doubles-death.html

Total COVID-19 deaths projected through August 4, 2020 in Illinois (7,830 5-12-2020) (7395 5-10-2020)(6,353 5-4-2020)  (2,337  4-29-2020)   (2,316 4-27-2020)  (2093 4-21-2020) (2,259 4-15-2020) (1248 4-13-2020)

(777 4-10-2020)  (1,584  4-8-2020) (3,629 4-5-2020)(3,386 4-2-2020) (2,789 4-1-2020)  (2,326  3-31-2020)  (2,369 as of 3/30/2020)  (2,454 AS OF 3-26-2020)

COVID-19 deaths   Peak deaths  (95 deaths on 4-19-2020)               Previously (91 deaths on 4-12-2020)  (208 on 4-12-2020) (109 on 4-20-2020)

Illinois Population:  12.74 million        Projected deaths per million: 498.67

For a lengthier discussion of the projection model go to:  http://boonecountywatchdog.blogspot.com/2020/03/forecasting-covid-19-impact-on-hospital.html and http://boonecountywatchdog.blogspot.com/2020/05/why-imhs-corvid-19-model-is-so-wrong.html

BOONE COUNTY


**************************************************************************************************************************************************************

This page summarizes the latest data for COVID-19 in McHenry County. This data is provisional and subject to change.

McHenry County Cases

McHenry County Cases


1,110

Source: McHenry County Department of Health

McHenry County Deaths


59

Source: McHenry County Department of Health

Above is from:  https://mchenry-county-coronavirus-response-mchenrycountygis.hub.arcgis.com/

*************************************************************************************************************************************************************************

.Winnebago County

Daily Report | COVID-19
COVID-19 Cases in the Community
May 13, 2020
Winnebago County

Confirmed Cases 1,179

Deaths 39

Recoveries 233


**********************************************************************************************************************************************

Cases in U.S.

Updated  May 14, 2020
U.S. At A Glance

As of May 13, 2020

Total Cases*

1,384,930   +20,869


Total Deaths

83,947   +1,701

This page will be updated daily. Numbers close out at 4 p.m. the day before reporting

***On Saturday and Sunday, the numbers in COVID-19: U.S. at a Glance and the figure describing the cumulative total number of COVID-departments. CDC will update weekend numbers the following Monday to reflect health department updates.***

CDC is responding to an outbreak of respiratory illness caused by a novel (new) coronavirus. The outbreak first started in Wuhan, China, but cases have been identified in a growing number of other locations internationally, including the United States. In addition to CDC, many public health laboratories are now testing for the virus that causes COVID-19.

COVID-19: U.S. at a Glance*†

  • Total cases (1,384,930  5-14-2020) (1,364,061 5-13-2020) (1,342,594  5-12-2020) (1,324,488  5-11-20200  (1,300,696  5-10-2020) (1,274,036  5-9-2020) (1,248,040 5-8-2020) (1,219,066  5-7-2020)(1,193,813  5-6-2020) (1,171,510 5-5-2020)  (1,152,372 5-4-2020 )(1,092,815 5-2-2020)   (1,062,446  5-1-2020)(1,031,659  4-30-2020)  (1,005,147  4-28-2020) (957,875  4-27-2020) (928,619  4-26-2020)  (895,766  4-25-2020)   (865,585 4-24-2020)   (829,441   4-23-2020) (802,583  4-22-2020) (776,093 4-21-2020) (746,625 4-20-2020) (720,630 4-19-2020)  (661,712 4-17-2020)  (632,548 4-16-2020)  (605,390 4-15-2020) (579,005 4-14-2020)  (554,849 4-13-2020) (525,704 4-12-2020)  (492,416 4-11-2020)(459,165 4-10-2020) (427,460 4-9-2020) (395,011 4-8-2020)(374,329 4-7-2020) (330,891 4-6-2020) (304,826 4-5-2020) (277,205 4-4-2020) (239,279 4-3-2020) (213,144 4/2/2020)(186,101 4/1/2020) (163,539 3/31/2020) (140,904 3/30/2020)   (122,653  3-29-2020)
  • Total deaths (83,947 5-15-2020) (82,246  5-13-2020)  (80,820  5-12-2020) (79,756  5-11-2020) (78,771  5-10-2020) (77,034  5-9-2020) (75,477  5-8-2020) (73,297  5-7-2020) (70,802 5-6-2020)  (68,279 5-5-2020) (67,456  5-4-2020)  (64,283  5-2-2020)  (62,405 5-1-2020)  (60,057  4-30-2020) (57,505  4-28-2020)  (53,922 4-27-2020) (52,459  4-26-2020)  (50,439 4-25-2020) (48,816  4-24-2020) (46,379 4-23-2020) (44,575 4-22-2020)  (41,759 4-21-2020) (39,083 4-20-2020)  (37,202 4-19-2020)  (33,049 4-17-2020)  (31,071 4-16-2020) (24,582 4-15-2020) (22,252 4-14-2020) (21,942 4-13-2020)  (20,486 4-12-2020)  (18,559 4-11-2020) (16,570 4-10-2020) (14,696 4-9-2020) (12,754 4-8-2020) (12,064 4-7-2020) (8,910 4-6-2020)(7,616 4-5-2020)  (6, 593 4-4-2020) (5,443 4-3-2020) (4,513 4-2-2020) (3,603 4-1-2020) (2,860 3/31/2020) (2,405 3/30/2020)   (2,112  3-29-2020)
  • Jurisdictions reporting cases: 55 (50 states, District of Columbia, Puerto Rico, Guam, Northern Marianas, and US Virgin Islands)

* Data include both confirmed and presumptive positive cases of COVID-19 reported to CDC or tested at CDC since January 21, 2020, with the exception of testing results for persons repatriated to the United States from Wuhan, China and Japan. State and local public health departments are now testing and publicly reporting their cases. In the event of a discrepancy between CDC cases and cases reported by state and local public health officials, data reported by states should be considered the most up to date.

† Numbers updated Saturday and Sunday are not confirmed by state and territorial health departments. These numbers will be modified when numbers are updated on Monday.(

Cases of COVID-19 Reported in the US, by Source of Exposure*†

* Data include both confirmed and presumptive positive cases of COVID-19 reported to CDC or tested at CDC since January 21, 2020, with the exception of testing results for persons repatriated to the United States from Wuhan, China and Japan. State and local public health departments are now testing and publicly reporting their cases. In the event of a discrepancy between CDC cases and cases reported by state and local public health officials, data reported by states should be considered the most up to date.

† CDC is no longer reporting the number of persons under investigation (PUIs) that have been tested, as well as PUIs that have tested negative. Now that states are testing and reporting their own results, CDC’s numbers are not representative of all testing being done nationwide.


Above is from:  https://www.cdc.gov/coronavirus/2019-ncov/cases-updates/cases-in-us.html

***************************************************************************************************************************************

Now being updated three times per week.

  For discussion go to: http://boonecountywatchdog.blogspot.com/2020/05/ihme-model-nearly-doubles-death.html

PROJECTIONS:   US COVID-19 Deaths thru 8-4-2020) (147,040 5-12-2020)  (137,184 5-10-2020) (134,475 5-4-2020)  (72,433   4-29-2020)  (74,073 4-27-2020) (65,976 4-21-2020)  (60,308 4-15-2020) (68,841 4-13-2020)  (61,543 4-10-2020) (60,415 4-8-2020) (81,766 4-5-2020) (93,531 4/3/2020) (93,765 4/1/2020)   (83.967 3/31/2020)    ( 82,141 3/30/2020);  Peak Daily    (2150 4-13-2020)

Older Peak Daily Deaths (2,212 on 4-12-2010)  (1,983 on 4-11-2020)  (2,644 on 4-16-2020)(3,130 on 4-16-2020) ( 2214 on 3/31/2020) (2,214 on 3/31/2 020) (2,271 3/30/2020)

US Population:  331 million    Projected deaths per million: 406.27

FROM:  http://www.healthdata.org/research-article/forecasting-covid-19-impact-hospital-bed-days-icu-days-ventilator-days-and-deaths Now being updated three times per week

*********************************************************************************************************************************************

COVID-19 Tracker   Great site to find specific county, state, country numbers is at:  https://bing.com/covid?form=msntrk  Site supplies case numbers, recovered cases and deaths by country and US state.

World population: 7.8  BILLION

Confirmed Cases:  4,434,590

Active cases

2,548,724

+61,030

Recovered cases

1,583,929

+65,505

Fatal cases

301,937

+7,782

Wednesday, May 13, 2020

State Projections from University of Washington Study: 5-12-2020


Projections from University of Washington Study
FROM:  http://www.healthdata.org/research-article/forecasting-covid-19-impact-hospital-bed-days-icu-days-ventilator-days-and-deaths
Home

Over the last weeks the IHME model has had some major swings in death projections for a number of states. The model is driven by updated data which is imputed three times per week.  For a description and discussion of the model GO TO:  http://boonecountywatchdog.blogspot.com/2020/03/forecasting-covid-19-impact-on-hospital.html

PROJECTION:

As of MAY 12, 2020, 2020

United States of America:  (147,040  5-12-2020)  (137,184 5-10-2020) (134,475 4-5-2020)  (74,073 2-27-2020) (67,641 4-22-2020)  (60,308  4-15-2020)  (68,841 4-13-2020) (61,545 4-10-2020)  (60,415 4-8-2020)  (81,766 4-5-2020) (93,531 4-4-2020) (93,765 4-1-2020)  Deaths

>Population 331 Millions  (2020)  444.23 per million

*******************************************************************************************************

Arizona  (2,871 5-12-2020) (2987  5-10-2020) (1,043  5-4-2020)

> 7.279 millions (2019)       399.42 per million 

California   (5,832 5-12-2020)  (6,086 5-10-2020)  (4,666  5-4-2020) (2,017  4-27-2020)  (1719  4-22-2020) ( 1,658  4-15-2020)  (1,483  4-13-2020)(1616 4-10-2020) (1,611 4-8-2020)  (1,783   4-5-2020) (5,068 4-3-2020) (5,161 4-1-2020)

>39.56 millions (2018)   147.42 per million

Florida: (5,819  5-12-2020)(3,971 5-4-2020) (1,914  4-27-2020) (1,620  4-22-2020)  (1,363  4-15-2020) (4,748  4-13-2020)  (3999 4-10-2020) (4,357 deaths 4-8-2020) (6770 4-5-2020) (6,897 4-3-2022)(6,937 4-1-2020)  47% increase

>Population  21.3 million (2018)   273.19 per million  

Illinois: (7830  5-12-2020) (7395 5-10-2020) (6,353  5-4-2020) (2316 4-27-2020) (2138  4-22-2020)  (2,259 4-15-2020)   (1,248 4-13-2020) (777 4-10-2020) (1,588 deaths 4-8-2020) (3,629 4-5-2020)(3,386  4-3-2020) (2786 4-1-2020)

>12.74 million (2018)  614.60 per million

Iowa: (710  5-12-2020)  (915  5-10-2020) 

>Population:  3.155 million   225.04 per million

Louisiana: (3169  5-12-2020) (3,232 5-10-2020)  (2,822 5-4-2020) (2,066  4-27-2020)   (1,780  4-22-2020)  (1,685  4-15-2020) (1,141  4-13-2020)  (1,125  4-10-2020) (946 deaths 4-8-2020) 746 4-5-2020

>4.6 million (2018)   688.91  per million

Massachusetts (9,629 5-12-2020) (7545  5-10-2020)  (7,697  5-4-2020) (5,498  4-27-2020)  (4,242  4-22-2020)  (3,236  4-15-2020) (8,219  4-13-2020) (6,739  4-10-2020) (5,625 4-8-2020) 8,254 deaths

>6.9 million (2018)   1,395.51 per million

Michigan  (6,621 5-12-2020) (6,217 5-10-2020)  (7,080  5-4-2020)  (3,785  4-27-2020)

> 9.987 million (2019)        662.96 per million

MINNESOTA (2,049  5-12-2020)  (2,073  5-10-2020) (2,183 5-4-2020)  (688  4-27-2020)   (360  4-22-2020) (195 4-15-2020)  (656  4-13-2020) 456 deaths 4-8-2020

>5.6 million  (2018)    365.89  per million

MISSOURI: (2348  5-12-2020)

>6.137million     382,60 per million

NEBRASKA  (184 5-12-2020) (218  5-10-2020) (380  5-4-2020) (463 4-27-2020)  (347 4-22-2020)

>1.9346  million   95.11 per million

New York (34,068 5-12-2020)(31,620 5-10-2020) (32,132  5-4-2020)  (23,930 4-27-2020)  (23,232 4-22-2020)  (21,812  4-15-2020)  (14,542  4-13-2020)  (13,442  4-10-2020)  13,307 death 4-8-2020) (15,618 4-5-2020) (16,261 4-3-2020) (16,090 4-1-2020)

>19.54 million (2018)  1,743.50 per million

Ohio:  (2,844  5-12-2020)  (2,960 5-10-2020)  (2,552  5-4-2020)   (853  4-27-2020) (808  4-4-22-2020) (716  4-15-2020)  (482 4-13-2020) (489  4-10-2020)  (489 4-8-2020) 544

>11.69 million (2018)   243.28 per million

Pennsylvania: (12,420 5-12-2020)  (10,742  5-10-2020)  (8,607 5-4-2020) (2596  4-27-2020)  (2,770  4-22-2020)  (1,707 4-15-2020)   (2,005  4-13-2020)

>12.8 million  (2019)    970.31 per million

Texas: (3,092 5-12-2020) (2,567 5-10-2020) (3,632  5-4-2020)  (1,656  4-27-2020)  (1,241  4-22-2020)  (957  4-15-2020)  (2,704  4-13-2020)  (2,350 4-10-2020)  (2,042 4-8-2020)  (2,025 4-5-2020)

>28.7 million (2018)  107.74 per million

Virginia (1,944   5-12-2020)  (1,396  5-10-2020)  (1,198 5-4-2020) (684 4-27-2020) (762 4-22-2020)  (763  4-15-2020)

> 8.536 million    227.74 per million

Washington: (1,193  5-12-2020)  (1,120  5-10-2020) (1,159 5-4-2020) (841 4-27-2020)  (813 4-22-2020)  (694  4-15-2020) (855 4-13-2020)  (842 4-10-2020)  (700 4-8-2020) (632  4-5-2020) (978 4-3-2020) (1,233 4-1-2020)

>7.536 million (2018)    158.31 per million

Wisconsin:  (673 5-10-2020)  (717 5-4-2020)  (331 4-27-2020)   (356  4-22-2020) (302  4-15-2020)   (339  4-13-2020)  (357 4-10-2020)  (424 4-8-2020) (644 deaths 4-5-2020) (951 4-3-2020) (926 4-1-2020)

>5.814 Million (2018)    115.76 per million

Will Mexico restart its auto parts plants?


Prodded by US, Mexico aims to restart industrial plants

By MARK STEVENSON6 minutes ago

1 of 12

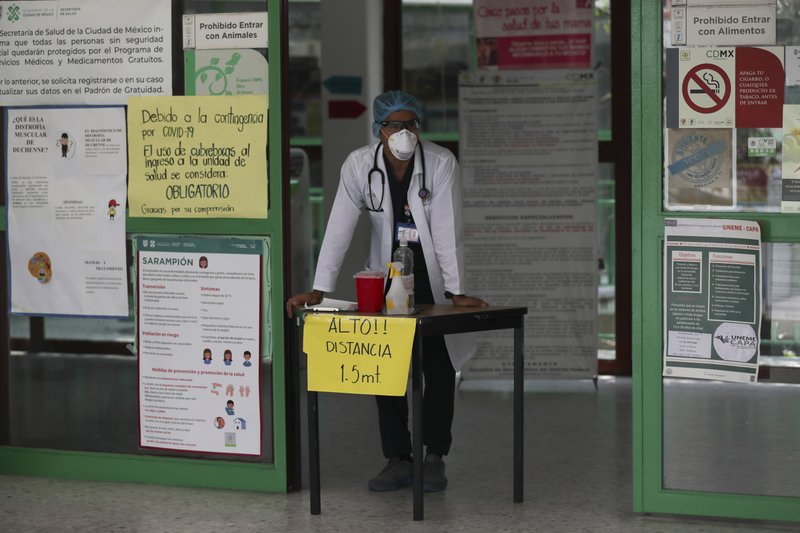
Dr. Jose Antonio Gama calls for the next patient at a medical center dedicated exclusively to the testing and treatment of patients with COVID-19, in Mexico City, Saturday, May 9, 2020. Health authorities concede that the real number of new coronavirus infections in the densely populated capital is many times higher than the official count, and authorities and experts agree that the worst is yet to come. (AP Photo/Fernando Llano)

MEXICO CITY (AP) — President Andrés Manuel López Obrador pledged Wednesday to begin reopening Mexico’s economy next week — under pressure at home and from U.S. officials — even as the country saw its largest one-day jump in coronavirus cases, hospitals are reeling, and testing remains inadequate.

Economy Secretary Graciela Marquez said the move would be “gradual, orderly and cautious,” and that by May 18, industries like construction, mining, and car and truck manufacturing would be allowed to resume.

A lockdown — which includes mandatory closures of “non essential” businesses and began in March — will remain in place, but work in the industries Marquez cited will be allowed to begin again because Mexico’s top advisory body on the pandemic, the General Health Council, said Tuesday it had decided to classify them as “essential activities.”

ADVERTISEMENT

Mexico has been under pressure from U.S. officials to reopen auto plants, in particular, because without them, integrated supply chains would make it hard for plants in the U.S. and Canada to reopen. At home, the National Alliance of Small Business Owners has also complained about lockdown measures, often imposed, quasi-legally, at the local level.

But others in Mexico fear a reopening — saying the measures were too long in coming and have been in place for too short a period of time. The announcement came as hospitals from Mexico City to its northern border with the U.S. were nearing overload, and manufacturing workers in border cities like Ciudad Juarez had only recently been sent home after demanding a shutdown in protests prompted by the wildfire spread of the coronavirus through their plants.

Mexican health officials on Tuesday reported the country’s largest single-day jump in COVID-19 case numbers, with 1,997 new cases and 353 deaths, bringing the total to has over 38,000 confirmed cases and almost 4,000 deaths.

Officials have acknowledged the actual number of infections is many times that. Mexico has done relatively little testing, with about 120,000 tests reported so far in a country of almost 130 million. That is equivalent to only about 0.6 people per 1,000 inhabitants tested, the lowest rate in the Organization for Economic Cooperation and Development.

That will make it hard to judge whether the reopening will risk a renewed upsurge in cases — and to see one coming if it does. Marquez, the economy secretary, said that schools and businesses would be allowed to reopen in 269 townships with no confirmed cases of COVID-19 — or in about one-tenth of Mexico’s 2,465 townships. They are largely located in rural areas in north-central and southeastern Mexico.


Dr. Miguel Betancourt, president of the Mexican Society of Public Health, cautioned against putting too much stock in the safety of opening places with no recorded cases, given the low level of testing.

“Without a well-implemented system of monitoring or an adequate laboratory testing capacity in these areas, they don’t really know precisely what the situation is,” he said. “Just because there aren’t any cases right now, doesn’t mean there won’t be later.”

The government is also pushing to restart plants along the border known as maquiladoras that produce parts critical the American car industry, after workers in Ciudad Juarez staged walkouts in recent weeks to get firms to shut down and send them home with full pay and despite reports from workers, companies and labor activists of dozens of deaths among employees in such plants.

Susana Prieto, a labor lawyer who advises workers at maquiladoras, said the decision showed the government was yielding to pressure from multinationals.

“Is it safe?” Prieto asked with disbelief. “It is safe to say that the president of Mexico is a puppet of Mexican and foreign (businesses) that do not care about the lives of Mexican workers?”

U.S. officials have suggested the supply chain of the North American free trade zone could be permanently affected if Mexican factories didn’t resume production.

Christopher Landau, the U.S. ambassador to Mexico, launched a Twitter campaign last month, writing: “There are risks everywhere, but we don’t all stay at home for fear we are going to get in a car accident ... The destruction of the economy is also a health threat.”

But the pressure for reopening is building as well in Mexican states where the lockdown has caused huge job losses.

Carlos Joaquin Gonzalez, the governor of the Caribbean coast state of Quintana Roo — home to resorts like Cancún — said his state has lost 22% of its jobs after about 8 million people cancelled trips to the area this year due to pandemic.

“Obviously, this requires us to think about reopening — as soon as possible,” Joaquin Gonzalez said.

For most people, the new coronavirus causes mild or moderate symptoms. For some, especially older adults and people with existing health problems, it can cause more severe illness and can lead to death.

Nationwide, Mexico has lost about 500,000 jobs due to the pandemic, and the auto industry appears eager to get back to work.

Volkswagen de Mexico said last week it is planning to reopen its assembly plant in Puebla state and its engine factory in Guanajuato state on June 1.

General Motors said it hadn’t fixed a date for reopening its plant, also in Guanajuato, but some workers there reported getting notices to report for work on May 18. Ford said it was waiting for government approval to reopen.

Officials also said other businesses and schools would begin to reopen. López Obrador said it would be left largely up to individual states to decide how to proceed.

The government of Mexico City, which has been hardest hit by the virus and where most of the hospitals are full, announced that manufacturing and construction can restart on June 1. Restaurants and department stores can open at one-third capacity starting June 15, and sports events can be played without spectators. Schools will reopen sometime in August.

Above is from:  https://apnews.com/1b85c48028b7b95ecb8c706bb5a29d04

May 13: 84,698 COVID-19 cases in Illinois


In response to the COVID-19 pandemic, Gov. JB Pritzker has ordered Illinois residents to stay at home. Executive Order No. 10 requires all residents to stay home, with exceptions for essential needs or business activities. Gatherings of 10 people or more are prohibited. The order extends through May 30, 2020.
COVID-19
Positive (Confirmed)
84,698   +1,677
Deaths
3,792   +191
Total Tests Performed*
489,359   +17,668
Total Cases
(84,698  5-13-2020) (83,021  5-12-2020)(79,007  5-11-2020) (77,741 5-10-2020)  (76,085  5-9-2020)(73,760  5-8-2020)(70,873 5-7-2020)(68,232  5-6-2020) (65,962  5-5-2020)  (63,840  5-4-2020) (61,499 5-3-2020) (58,505  5-2-2020)  56,055 5-1-2020) (52,918  4-30-2020) (50,355  4-29-3030) (48,102 4-28-2020) (45,883  4-27-2020) (43,903  4-26-2020) ( 41,777  4-25-2020) (39,658  4-24-2020)  (36,934 4-23-2020)  (35,108 4-22-2020)(33,059  4-21-2020) (31,508  4-20-2020) (30,357 4-19-2020)  (29,160  4-18-2020)  (27,575  4-17-2020) (25,733  4-16-2020)  (24,593 4-15-2020)  (23,247 4-14-2020)  (22,025 4-13-2020)  (20,852 4-12-2020) (19,180 4-11-2020 ) (17,887 4-10-2020) (16,422 4-9-2020) (15,078 4-8-2020) (13,549 4-7-2020) (12,262 4-6-2020) (11,256 4-5-2020) (10,357 4/4/2020) (8,904-- 4/3/2020) (7,695-- 4/2/2020)   (6,980-- 4/1/2020) (5,994-- 3/31/2020)  (5,05--7 3/30/2020) (4,596-- 3/29/2020)

Deaths

(3,792 5-13-2020) (3,601 5-12-2020)  (3,459  5-11-2020) (3,406 5-10-2020) (3349 5-9-2020) (3,241 5-8-2020) (3,111  5-7-2020)(2,974  5-6-2020) ((2,838 5-5-2020)  (2662 5-4-2020) (2,618 5-3-2020) (2,559 5-2-2020) (2,457 5-1-2020) (2,355  4-30-2020) (2,215  4-29-2020)  (2,125  4-28-2020) (1,983  4-27-2020) (1,933 4-26-2020 )(1,874  4-25-2020) 1,795  4-22-2020) (1,688  2-23-2020) (1,585 4-22-2020) (1,468  4-21-2020) (1,349 4-20-2020)(1,290 4-18-2020)  (1,259  4-18-2020) (1,134  4-17-2020) (1,072  4-16-2020) (948 4-15-2020)  (866 4-14-2020) (794 4-13-2020)  (720 4-12-2020) (677 4-11-2020)(596 4-10-2020) (528 4-9-2020) (462 4-8-2020) (380 4-7-2020)(307 4-6-2020) (274 4-5-2020) (243—4-4-2020) (210-- 4-3-2020) (157 4-2-2020)(141 4/1/2020) (99 3/31/2020) (73 3/30/2020)  (65 3/29/2020)
Total Persons Tested*
(489,359  5-13-2020)(471,691 5-12-2020) (442,425  5-11-2020) (429,984  5-10-2020) (416,331 5-9-2020)  (399,714 5-8-2020)  (379,033 5-7-2020)(361,260 5-6-2020) (346,286 5-5-20200 (333,147  5-4-2020) (319,313  5-3-2020) (299,892 5-2-2020)  (284,688  5-1-2020) (269,867 4-30-2020) (256,667  4-29-2020) (242,189  4-28-2020) (227,628  4-27-2020) (214,952 4-26-2020) (201,617 4-25-2020) (186,219  4-24-2020)(173,316 4-23-2020) (164,346 4-22-2020)  (154,997  4-21-2020) (148,358 4-20-2020) (143,318 4-19-2020)  (137,404  4-18-2020) (130,163  4-17-2020)  (122,589  4-16-2020)  (116,929 4-15-2020) (110,616 4-14-2020)  (105,768 4-13-2020) (100,735 4-12-2020) (92,779 4-11-2020) (87,527 4-10-2020) (86,857 4-9-2020) (75,066 4-8-2020) (68,732 4-7-2020) (62,942 4-6-2020) (58,983 4-5-2020) (53,581—4-4-2020)  (48,048-- 4-3-2020) (43,653-- 4/2/2020) (40,384-- 4/1/2020) (35,225-- 3-31-2020) (30,446-- 3/30/2020)  (27,762-- 3/29/2020)

*Total number of people reported electronically for testing of COVID-19 at IDPH, commercial or hospital laboratories. Deaths are included in the number of positive cases
All numbers displayed are provisional and subject to change.

Information to be updated daily.

Above is from: http://www.dph.illinois.gov/covid19/covid19-statistics

*****************************************************************************************************************************

Home


PROJECTIONS from:  http://www.healthdata.org/research-article/forecasting-covid-19-impact-hospital-bed-days-icu-days-ventilator-days-and-deaths Now being updated three times per week.

HUGE INCREASE IN PROJECTED DEATHS    For discussion go to: http://boonecountywatchdog.blogspot.com/2020/05/ihme-model-nearly-doubles-death.html

Total COVID-19 deaths projected through August 4, 2020 in Illinois (7,830 5-12-2020) (7395 5-10-2020)(6,353 5-4-2020)  (2,337  4-29-2020)   (2,316 4-27-2020)  (2093 4-21-2020) (2,259 4-15-2020) (1248 4-13-2020)

(777 4-10-2020)  (1,584  4-8-2020) (3,629 4-5-2020)(3,386 4-2-2020) (2,789 4-1-2020)  (2,326  3-31-2020)  (2,369 as of 3/30/2020)  (2,454 AS OF 3-26-2020)

COVID-19 deaths   Peak deaths  (95 deaths on 4-19-2020)               Previously (91 deaths on 4-12-2020)  (208 on 4-12-2020) (109 on 4-20-2020)

Illinois Population:  12.74 million        Projected deaths per million: 498.67

For a lengthier discussion of the projection model go to:  http://boonecountywatchdog.blogspot.com/2020/03/forecasting-covid-19-impact-on-hospital.html and http://boonecountywatchdog.blogspot.com/2020/05/why-imhs-corvid-19-model-is-so-wrong.html

BOONE COUNTY


**************************************************************************************************************************************************************

This page summarizes the latest data for COVID-19 in McHenry County. This data is provisional and subject to change.

McHenry County Cases

1,077

Source: McHenry County Department of Health

McHenry County Deaths


58

Source: McHenry County Department of Health

Above is from:  https://mchenry-county-coronavirus-response-mchenrycountygis.hub.arcgis.com/

*************************************************************************************************************************************************************************

.Winnebago County

Daily Report | COVID-19
COVID-19 Cases in the Community
May 13, 2020
Winnebago County

Confirmed Cases 1,179

Deaths 39


Recoveries 233


**********************************************************************************************************************************************

Cases in U.S.

Updated  May 13, 2020
U.S. At A Glance

As of May 12, 2020

Total Cases*

1,364,061   +21,467


Total Deaths

82,246   +1,426

This page will be updated daily. Numbers close out at 4 p.m. the day before reporting

***On Saturday and Sunday, the numbers in COVID-19: U.S. at a Glance and the figure describing the cumulative total number of COVID-departments. CDC will update weekend numbers the following Monday to reflect health department updates.***

CDC is responding to an outbreak of respiratory illness caused by a novel (new) coronavirus. The outbreak first started in Wuhan, China, but cases have been identified in a growing number of other locations internationally, including the United States. In addition to CDC, many public health laboratories are now testing for the virus that causes COVID-19.

COVID-19: U.S. at a Glance*†

  • Total cases (1,364,061 5-13-2020) (1,342,594  5-12-2020) (1,324,488  5-11-20200  (1,300,696  5-10-2020) (1,274,036  5-9-2020) (1,248,040 5-8-2020) (1,219,066  5-7-2020)(1,193,813  5-6-2020) (1,171,510 5-5-2020)  (1,152,372 5-4-2020 )(1,092,815 5-2-2020)   (1,062,446  5-1-2020)(1,031,659  4-30-2020)  (1,005,147  4-28-2020) (957,875  4-27-2020) (928,619  4-26-2020)  (895,766  4-25-2020)   (865,585 4-24-2020)   (829,441   4-23-2020) (802,583  4-22-2020) (776,093 4-21-2020) (746,625 4-20-2020) (720,630 4-19-2020)  (661,712 4-17-2020)  (632,548 4-16-2020)  (605,390 4-15-2020) (579,005 4-14-2020)  (554,849 4-13-2020) (525,704 4-12-2020)  (492,416 4-11-2020)(459,165 4-10-2020) (427,460 4-9-2020) (395,011 4-8-2020)(374,329 4-7-2020) (330,891 4-6-2020) (304,826 4-5-2020) (277,205 4-4-2020) (239,279 4-3-2020) (213,144 4/2/2020)(186,101 4/1/2020) (163,539 3/31/2020) (140,904 3/30/2020)   (122,653  3-29-2020)
  • Total deaths (82,246  5-13-2020)  (80,820  5-12-2020) (79,756  5-11-2020) (78,771  5-10-2020) (77,034  5-9-2020) (75,477  5-8-2020) (73,297  5-7-2020) (70,802 5-6-2020)  (68,279 5-5-2020) (67,456  5-4-2020)  (64,283  5-2-2020)  (62,405 5-1-2020)  (60,057  4-30-2020) (57,505  4-28-2020)  (53,922 4-27-2020) (52,459  4-26-2020)  (50,439 4-25-2020) (48,816  4-24-2020) (46,379 4-23-2020) (44,575 4-22-2020)  (41,759 4-21-2020) (39,083 4-20-2020)  (37,202 4-19-2020)  (33,049 4-17-2020)  (31,071 4-16-2020) (24,582 4-15-2020) (22,252 4-14-2020) (21,942 4-13-2020)  (20,486 4-12-2020)  (18,559 4-11-2020) (16,570 4-10-2020) (14,696 4-9-2020) (12,754 4-8-2020) (12,064 4-7-2020) (8,910 4-6-2020)(7,616 4-5-2020)  (6, 593 4-4-2020) (5,443 4-3-2020) (4,513 4-2-2020) (3,603 4-1-2020) (2,860 3/31/2020) (2,405 3/30/2020)   (2,112  3-29-2020)
  • Jurisdictions reporting cases: 55 (50 states, District of Columbia, Puerto Rico, Guam, Northern Marianas, and US Virgin Islands)

* Data include both confirmed and presumptive positive cases of COVID-19 reported to CDC or tested at CDC since January 21, 2020, with the exception of testing results for persons repatriated to the United States from Wuhan, China and Japan. State and local public health departments are now testing and publicly reporting their cases. In the event of a discrepancy between CDC cases and cases reported by state and local public health officials, data reported by states should be considered the most up to date.

† Numbers updated Saturday and Sunday are not confirmed by state and territorial health departments. These numbers will be modified when numbers are updated on Monday.(

Cases of COVID-19 Reported in the US, by Source of Exposure*†

* Data include both confirmed and presumptive positive cases of COVID-19 reported to CDC or tested at CDC since January 21, 2020, with the exception of testing results for persons repatriated to the United States from Wuhan, China and Japan. State and local public health departments are now testing and publicly reporting their cases. In the event of a discrepancy between CDC cases and cases reported by state and local public health officials, data reported by states should be considered the most up to date.

† CDC is no longer reporting the number of persons under investigation (PUIs) that have been tested, as well as PUIs that have tested negative. Now that states are testing and reporting their own results, CDC’s numbers are not representative of all testing being done nationwide.

Above is from:  https://www.cdc.gov/coronavirus/2019-ncov/cases-updates/cases-in-us.html

***************************************************************************************************************************************

Now being updated three times per week.

HUGE INCREASE IN PROJECTED DEATHS    For discussion go to: http://boonecountywatchdog.blogspot.com/2020/05/ihme-model-nearly-doubles-death.html

PROJECTIONS:   US COVID-19 Deaths thru 8-4-2020) (147,040 5-12-2020)  (137,184 5-10-2020) (134,475 5-4-2020)  (72,433   4-29-2020)  (74,073 4-27-2020) (65,976 4-21-2020)  (60,308 4-15-2020) (68,841 4-13-2020)  (61,543 4-10-2020) (60,415 4-8-2020) (81,766 4-5-2020) (93,531 4/3/2020) (93,765 4/1/2020)   (83.967 3/31/2020)    ( 82,141 3/30/2020);  Peak Daily    (2150 4-13-2020)

Older Peak Daily Deaths (2,212 on 4-12-2010)  (1,983 on 4-11-2020)  (2,644 on 4-16-2020)(3,130 on 4-16-2020) ( 2214 on 3/31/2020) (2,214 on 3/31/2 020) (2,271 3/30/2020)

US Population:  331 million    Projected deaths per million: 406.27

FROM:  http://www.healthdata.org/research-article/forecasting-covid-19-impact-hospital-bed-days-icu-days-ventilator-days-and-deaths Now being updated three times per week

*********************************************************************************************************************************************

COVID-19 Tracker   Great site to find specific county, state, country numbers is at:  https://bing.com/covid?form=msntrk  Site supplies case numbers, recovered cases and deaths by country and US state.

World population: 7.8  BILLION
Total confirmed cases
4,308,055

Active cases

2,495,476

+37,441

Recovered cases

1,518,424

+37,110

Fatal cases

294,155

+4,223

World Projections from University of Washington Study: 5-12-2020


Projections from University of Washington Study

Projected Deaths are through 8-4-2020.  Projections were supplied by IHME on 5-12--2020,

FROM:  http://www.healthdata.org/research-article/forecasting-covid-19-impact-hospital-bed-days-icu-days-ventilator-days-and-deaths
Home 
Most nations listed below had small increases in projected deaths.  Sweden’s projections have been cut in half and are now inline with Spain and Italy.  Quite a change for Sweden which has very limited restriction on its citizens and was nearly twice as high of mortality projections than the other high projections.

In descending order the projected deaths per million are:  United Kingdom(652),Spain (630), Italy (582), Sweden (563), France (477), USA (445), Ireland (351), Denmark (126), Germany (119), Finland (74) Norway (42), Greece (15).

***************************************************************************************************************************************************************************

United States of America—population 331 million (2020)

peak:  1,983 on 4-11-2020

Total Death Projected: (147,040  5-12-2020)  (137,184  5-10-2020)  (134,475 5-4-2020)   (72,860 4-28-2020) (65,976 4-21-2020) (60,308 4-15-2020)   (68,841 4-10-2020)  (61,545 4-10-2020)

Deaths per million: 444,23

******************************************************************************************************************************************************************

UNITED KINGDOM—.population 66.65 million  (2019)

peak:  ( 1,285 on  4-21-2020)1,156 on 4-13-2020

Total Death Projected  (43,479 5-12-2020)  (40,555  5-10-2020) (40,555 5-4-2020)  (31,476 4-28-2020)  (33,142  4-21-2020)  (37,521 4-15-2020)   (23,791 4-13-2020)  (37,494 4-10-2020)

Deaths per million: 652.35

**************************************************************************************************************************

SWEDEN—population 10.23 million (2019)

Peak:    (204 on 5-19-2020)  (127 ON 5-1-2020) on 5-8-2020

Total Death Projected (5,760  5-12-2020) (10,196 5-10-2020)  (10,196 5-4-2020)  (15,625  4-28-2020)   (9191 4-21-2020) (15,890 4-15-2020)  (18,322  4-13-2020)  (13,259 4-10-2020)

Deaths per million:  563.05

*******************************************************************************************************************************

SPAIN—population 46.94 million (2019)

Peak;  950 on 4-1-2020

Total  Deaths Projected: (29,581 5-12-2020)  (27,727 5-10-2020) (27,727 5-4-2020) (25,329  4-28-2020) (24,624 4-21-2020)   (23,680 4-15-2020)  (18,713  4-13-2020)   (18,363  4-10-2020)

Deaths per million:  630.19

***************************************************************************************************************************************

NORWAY—population 5.368 million  (2019)

peak:  19 on 5-4-2020

Total Deaths Projected:  (225 5-12-2020)  (284 5-10-2020)  (284 5-4-2020)  (336 4-21-2020)   ( 280  4-17-2020)( 811 4-13-2020)

Deaths per million:  41.92*

*Through May4, 2020

*******************************************************************************************************************************************

ITALY—population 60.36  million (2019)

peak:  969 3-27-2020

Total Deaths Projected  (35,137  5-12-20200 (31,459  5-10-2020)  (31,458 5-4-2020) (27,544  4-29-2020)  (26,600  4-21-2020) (26,007  4-17-2020) (21,130 4-13-2020) (20,333 4-10-2020)

Deaths per million:  582.17

**************************************************************************************************************************************

IRELAND—population 4.94 million  (2020)

peak:  36 on 4-7-2020

Total Deaths Projected (1,736 5-12-2020)  (1,698 5-10-2020)  (1,698 5-4-2020)  (1,404  4-28-2020) (987  4-21-2020)  (890 4-17-2020)  (527  4-13-2020) (500 4-13-2020)

Deaths per million: 351.42

****************************************************************************************************************************************

GREECE—population 10.72  (2019)

peak  11 on 4-23-2020

Total Deaths Projected  (164  5-12-2020) (152 5-10-2020)(152 5-4-2020)   (140  4-28-2020)  (123 4-21-2020)  (119  4-17-2020)  (374  4-13-2020)

Deaths per million:  15.30

********************************************************************************************************************************************

GERMANY—population 83.02 million  (2019)

peak:  247 on 4-12-2020

Total Deaths Projected: (9,905  5-12-2020) (8,543 5-10-2020)  (8,543  5-4-2020)  (6,946   4-28-2020)   (5913  4-21-2020)  (4,957  4-17-2020)  (7,332 4-13-2020) (7,080 4-10-2020)

Deaths per million:   119.31

*************************************************************************************************************************************************

FRANCE—population 65.27 million (2020)

peak:  920 on 4-6-202

Total Projected Deaths:  (31,155  5-12-2020)  (28,859  5-10-2020) (28,859 5-4-2020)  (24,918  4-28-2020)  (23,104  4-21-2020)  (22,555  4-17-2020 )(17,448  4-13-2020)  (15,741  4-10-2020)

Deaths per million:  477.33

***************************************************************************************************************************************************

FINLAND—population 5.52  (2019)

peak 8 on 4-13-2020

Total Projected Deaths  (410 5-12-2020)  (299 5-10-2020)  (299 5-4-2020)  (433  4-28-2020)  (167  4-21-2020)   (118 4-17-2020)

Deaths per million:  74.28

******************************************************************************************************************************************************

DENMARK—population 5.77 (2019)

peak 45 on 5-4-2020

Total Projected deaths   (728  5-12-2020)  (806  5-10-2020) (806 5-4-2020)  (559 4-28-2020)  (772  4-21-2020) (683  4-17-2020)(1,669 4-13-2020)

Deaths per million:  126.17

Tuesday, May 12, 2020

Boone/DeKalb/Winnebago are in Region 1 of Northcentral; McHenry/Kane in Region 9 of Northeast

The Regions and Phases of Pritzker’s Plan To Reopen Illinois

By MARY HANSEN • MAY 8, 2020

ShareTweetEmail

  • Gov. J.B. Pritzker's plan to reopen Illinois breaks the state into four regions.

    Gov. J.B. Pritzker's plan to reopen Illinois breaks the state into four regions.

    RESTORE ILLINOIS PLAN, OFFICE OF THE GOVERNOR

Illinois is in Phase 2 of Restore Illinois – the five-step plan Gov. J.B. Pritzker unveiled this week to reopen schools, colleges, parks and businesses, while addressing the coronavirus pandemic.

Some state parks are open. More shops can operate to fill online and pick up orders, and in some places, residents can go to a drive-in movie theater. While the stay-at-home order still applies to the whole state, Pritzker said going forward, that will change as it’s a regional plan.

“Reality on the ground looks different in different areas of the state,” Pritzker said at a recent press briefing.

Some Republicans and business groups have criticized the regions for being too vast and the timeline too slow, wreaking further havoc on the economy.

Pritzker defends the plan, saying he’s basing it on guidance from public health and medical experts, and that he consulted with business leaders, mayors and officials from around the state.

Dr. Mark Dworkin - a professor of epidemiology at the University of Illinois Chicago School of Public Health – said Pritzker’s approach is ‘thoughtful,’ but alternatives are possible.

“Especially with no major science behind what we're doing, but just trying to use expert opinion and good judgment,” he said. “But we should beware of a situation where we're talking about our politicians because… they are preset to disagree with whatever the other group is.”

An explanation of the phases is below and in the governor’s plan. Movement between the next two phases depends on a region keeping the share of new positive tests low for two weeks, hospital admissions have to be stable for nearly a month, and the region has to have enough hospital beds and equipment to respond to a surge in new COVID-19 patients. Testing must also be expanded and contact tracing robust.

But there’s a catch to moving on from Phase 4, the one before mostly returning to normal: the state could be here for months.

“Until we have a vaccine or an effective treatment or enough widespread immunity that new cases fail to materialize – the option to return to normal doesn’t exist,” Pritzker said.

Debate Over Regions

The plan combines the 11 regions the Illinois Department of Public Health established for Emergency Medical Services into four: Northeast with Chicago and its suburbs; North-Central Illinois from the border with Wisconsin down to Peoria and Bloomington; Central Illinois from Danville to Quincy, including Springfield and Champaign-Urbana, and finally Southern Illinois, including the Metro-East and Carbondale.


Illinois House Minority Leader Jim Durkin and his fellow Republicans took to Zoom this week to criticize it, saying that there is not enough local control over moving from phase to phase.

“I'm here to raise a warning flag that Watseka, Illinois is very different than Quincy, not only just four hours away,” he said. “The plan is set up in an unworkable way.”

The cities he references are both in the Central Illinois region. Durkin went on to say that the plan would destroy many small businesses and manufacturers.

State Rep. Ryan Spain, who was at the virtual press conference, is a Republican from Peoria, where he says hospitalization rates, new cases and intensive care unit capacity have all been meeting the governor’s benchmarks to start loosening more restrictions.

“We have been meeting them now for the last four weeks,” he said. “So that takes me to the third problem, which is the arbitrary establishment of some of the time periods included in the governor's plan.”

Spain took issue with May 1 as the start date for IDPH to track metrics. That means no region can open up more until the end of the month.

Pritzker defended the designation, saying that is when some regulations loosened, such as allowing more retail stores to open.

On the region size, public health experts NPR Illinois interviewed said the larger population size in the regions could ensure that smaller or single outbreaks don’t cause big swings in the metrics the public health department is tracking.

“When you get that number of people to assess, you’ve got a good denominator on which to make decisions,” said Dr. Jerry Kruse, CEO of SIU Medicine in Springfield and dean of the Southern Illinois University School of Medicine.

Timeline

Pritzker has faced criticism for using a 28-day timeframe between phases, while other states, including New York, are using 14 days. Two weeks is thought to be the incubation period for the coronavirus.

Dworkin, the UIC epidemiologist, said four weeks - or two incubation periods - is more cautious.

“It's giving you more comfort that when you make that change, you're that much more sure what's going on,” he said.


That could mean there is less of a chance for moving backward and having to institute more restrictions.

Dworkin said he understands living with restrictions until a vaccine or treatment is available is uncomfortable.

But the alternative is worse - more infections and deaths until herd immunity is reached.

“Why would we take the hose off of the fire?” Dworkin asked. “What would we expect to happen if we did that, because we're tired of holding the hose? We can expect the fire to burn faster and harder than it was with the water on it.”

According to the metric tracker on IDPH’s website, all the regions except Chicago are on track to meet criteria to move on to Phase 3 at the end of May.

Phases

The state is divided into four regions, and each can move forward – or backward – through the five phases of the plan as they meet certain medical benchmarks:

Phase 1 (Illinois began in March) : Broad stay-at-home order, with only grocery stores, pharmacies and other essential businesses open. Bars and restaurants are only open for pick-up and delivery orders. Only essential manufacturers can operate.

To move to the next phase: The growth of new cases must slow, and surge capacity of hospital beds and ventilators must be available. Testing must be available for any healthcare worker or first responder with symptoms, and 10,000 tests done daily statewide.

(All regions are currently in Phase 2)

Phase 2 (Began May 1) : Stay-at-home order continues, but more retail stores can open to fill on)ine and pick-up orders, similar to restaurants. Face coverings are required where social distancing isn’t possible, and some outdoor activities, such as boating, fishing and golfing, are allowed.

To move to the next phase: A region must keep the share of new positive tests at 20% or below for two weeks, with no major spikes. Hospital admissions for COVID-19 have to be stable for 28 days, and the region has to have 14% of hospital beds and equipment available to respond to a surge in new COVID-19 patients. Testing availability must expand to anyone with underlying conditions, as well as residents and staff as nursing homes, jails and other congregate settings. Contact tracing begins within 24 hours of diagnosis.

Phase 3: Offices, salons and barber shops can open, with capacity limits and other safety precautions. Face coverings are still required. Any gatherings of 10 or fewer are allowed.

To move to the next phase: The positivity rate and hospital admission criteria are the same as moving from Phase 2 to Phase 3. Testing must be available for anyone, regardless of symptoms. Contact tracing must begin within 24 hours for more than 90% of the cases in the region.

Phase 4: Childcare centers and schools, as well as bars and restaurants can reopen, all with safety guidelines from the Illinois Department of Public Health. Any gatherings of 50 people or fewer are allowed. Travel resumes.

To move to the next phase: A vaccine or effective treatment must be widely available. Alternatively, a region has reached herd immunity and there are no new cases over a sustained period of time.

Phase 5: Conventions, large events and festivals are permitted. All businesses, schools and recreation can resume with safety guidance

Above is from:  https://www.nprillinois.org/post/regions-and-phases-pritzker-s-plan-reopen-illinois

************************************************************************************************************************

All Illinois Regions on Track to Move to Next Phase of Reopening Except One, Pritzker Says

No region can officially move forward until May 29, under the parameters of the governor's plan

Published May 11, 2020 • Updated on May 11, 2020 at 7:08 pm


Illinois Gov. J.B. Pritzker announced Monday that three of Illinois’ four medical regions are currently on track to move into phase three of the state’s phased reopening plan, but one key region still has work to do to be able to reopen more businesses and loosen more restrictions amid the coronavirus pandemic.

According to Pritzker the North Central, Central and Southern regions of the state are all hitting the metrics required to move into phase three of the reopening plan later this month, but the Northeast region, which includes Chicago and most of the city’s suburbs, is not.

The Northeast region includes Cook County, as well as McHenry, Lake, Kane, DuPage, Kendall, Grundy, Will and Kankakee counties.

Above is from:  https://www.nbcchicago.com/news/coronavirus/all-illinois-regions-on-track-to-move-to-next-phase-of-reopening-except-one-pritzker-says/2270110/

May 12: 83,021 COVID-19 cases in Illinois


In response to the COVID-19 pandemic, Gov. JB Pritzker has ordered Illinois residents to stay at home. Executive Order No. 10 requires all residents to stay home, with exceptions for essential needs or business activities. Gatherings of 10 people or more are prohibited. The order extends through May 30, 2020.
COVID-19
Positive (Confirmed)
83,021     +4,014
Deaths
3,601     +142
Total Tests Performed*
471,691    +29,266
Total Cases
(83,021  5-12-2020)(79,007  5-11-2020) (77,741 5-10-2020)  (76,085  5-9-2020)(73,760  5-8-2020)(70,873 5-7-2020)(68,232  5-6-2020) (65,962  5-5-2020)  (63,840  5-4-2020) (61,499 5-3-2020) (58,505  5-2-2020)  56,055 5-1-2020) (52,918  4-30-2020) (50,355  4-29-3030) (48,102 4-28-2020) (45,883  4-27-2020) (43,903  4-26-2020) ( 41,777  4-25-2020) (39,658  4-24-2020)  (36,934 4-23-2020)  (35,108 4-22-2020)(33,059  4-21-2020) (31,508  4-20-2020) (30,357 4-19-2020)  (29,160  4-18-2020)  (27,575  4-17-2020) (25,733  4-16-2020)  (24,593 4-15-2020)  (23,247 4-14-2020)  (22,025 4-13-2020)  (20,852 4-12-2020) (19,180 4-11-2020 ) (17,887 4-10-2020) (16,422 4-9-2020) (15,078 4-8-2020) (13,549 4-7-2020) (12,262 4-6-2020) (11,256 4-5-2020) (10,357 4/4/2020) (8,904-- 4/3/2020) (7,695-- 4/2/2020)   (6,980-- 4/1/2020) (5,994-- 3/31/2020)  (5,05--7 3/30/2020) (4,596-- 3/29/2020)

Deaths

(3,601 5-12-2020)  (3,459  5-11-2020) (3,406 5-10-2020) (3349 5-9-2020) (3,241 5-8-2020) (3,111  5-7-2020)(2,974  5-6-2020) ((2,838 5-5-2020)  (2662 5-4-2020) (2,618 5-3-2020) (2,559 5-2-2020) (2,457 5-1-2020) (2,355  4-30-2020) (2,215  4-29-2020)  (2,125  4-28-2020) (1,983  4-27-2020) (1,933 4-26-2020 )(1,874  4-25-2020) 1,795  4-22-2020) (1,688  2-23-2020) (1,585 4-22-2020) (1,468  4-21-2020) (1,349 4-20-2020)(1,290 4-18-2020)  (1,259  4-18-2020) (1,134  4-17-2020) (1,072  4-16-2020) (948 4-15-2020)  (866 4-14-2020) (794 4-13-2020)  (720 4-12-2020) (677 4-11-2020)(596 4-10-2020) (528 4-9-2020) (462 4-8-2020) (380 4-7-2020)(307 4-6-2020) (274 4-5-2020) (243—4-4-2020) (210-- 4-3-2020) (157 4-2-2020)(141 4/1/2020) (99 3/31/2020) (73 3/30/2020)  (65 3/29/2020)
Total Persons Tested*
(471,691 5-12-2020) (442,425  5-11-2020) (429,984  5-10-2020) (416,331 5-9-2020)  (399,714 5-8-2020)  (379,033 5-7-2020)(361,260 5-6-2020) (346,286 5-5-20200 (333,147  5-4-2020) (319,313  5-3-2020) (299,892 5-2-2020)  (284,688  5-1-2020) (269,867 4-30-2020) (256,667  4-29-2020) (242,189  4-28-2020) (227,628  4-27-2020) (214,952 4-26-2020) (201,617 4-25-2020) (186,219  4-24-2020)(173,316 4-23-2020) (164,346 4-22-2020)  (154,997  4-21-2020) (148,358 4-20-2020) (143,318 4-19-2020)  (137,404  4-18-2020) (130,163  4-17-2020)  (122,589  4-16-2020)  (116,929 4-15-2020) (110,616 4-14-2020)  (105,768 4-13-2020) (100,735 4-12-2020) (92,779 4-11-2020) (87,527 4-10-2020) (86,857 4-9-2020) (75,066 4-8-2020) (68,732 4-7-2020) (62,942 4-6-2020) (58,983 4-5-2020) (53,581—4-4-2020)  (48,048-- 4-3-2020) (43,653-- 4/2/2020) (40,384-- 4/1/2020) (35,225-- 3-31-2020) (30,446-- 3/30/2020)  (27,762-- 3/29/2020)

*Total number of people reported electronically for testing of COVID-19 at IDPH, commercial or hospital laboratories. Deaths are included in the number of positive cases
All numbers displayed are provisional and subject to change.

Information to be updated daily.

Above is from: http://www.dph.illinois.gov/covid19/covid19-statistics

*****************************************************************************************************************************

Home


PROJECTIONS from:  http://www.healthdata.org/research-article/forecasting-covid-19-impact-hospital-bed-days-icu-days-ventilator-days-and-deaths Now being updated three times per week.

HUGE INCREASE IN PROJECTED DEATHS    For discussion go to: http://boonecountywatchdog.blogspot.com/2020/05/ihme-model-nearly-doubles-death.html

Total COVID-19 deaths projected through August 4, 2020 in Illinois (7,830  5-12-2020) (7395 5-10-2020)(6,353 5-4-2020)  (2,337  4-29-2020)   (2,316 4-27-2020)  (2093 4-21-2020) (2,259 4-15-2020) (1248 4-13-2020)

(777 4-10-2020)  (1,584  4-8-2020) (3,629 4-5-2020)(3,386 4-2-2020) (2,789 4-1-2020)  (2,326  3-31-2020)  (2,369 as of 3/30/2020)  (2,454 AS OF 3-26-2020)

COVID-19 deaths   Peak deaths  (95 deaths on 4-19-2020)               Previously (91 deaths on 4-12-2020)  (208 on 4-12-2020) (109 on 4-20-2020)

Illinois Population:  12.74 million        Projected deaths per million: 498.67

For a lengthier discussion of the projection model go to:  http://boonecountywatchdog.blogspot.com/2020/03/forecasting-covid-19-impact-on-hospital.html and http://boonecountywatchdog.blogspot.com/2020/05/why-imhs-corvid-19-model-is-so-wrong.html

BOONE COUNTY

**************************************************************************************************************************************************************

This page summarizes the latest data for COVID-19 in McHenry County. This data is provisional and subject to change.

McHenry County Cases


McHenry County Cases


1,030

Source: McHenry County Department of Health

McHenry County Deaths


54

Source: McHenry County Department of Health


Above is from:  https://mchenry-county-coronavirus-response-mchenrycountygis.hub.arcgis.com/

*************************************************************************************************************************************************************************

.

WINNEBAGO COUNTY (WREX) — The Winnebago County Health Department is reporting 32 new COVID-19 cases Sunday.

The county now has surpassed 900 cases with a total of 926. The county's number of deaths still sits at 26.

The county said 206 people have recovered from the virus so far.

There is a total of 5,239 negative tests in Winnebago County.

Devin Brooks


**********************************************************************************************************************************************

Cases in U.S.

Updated  May 12, 2020
U.S. At A Glance

As of May 11, 2020

Total Cases*

1,342,594   +18,106


Total Deaths 

80,820   +1,074


This page will be updated daily. Numbers close out at 4 p.m. the day before reporting


***On Saturday and Sunday, the numbers in COVID-19: U.S. at a Glance and the figure describing the cumulative total number of COVID-departments. CDC will update weekend numbers the following Monday to reflect health department updates.***

CDC is responding to an outbreak of respiratory illness caused by a novel (new) coronavirus. The outbreak first started in Wuhan, China, but cases have been identified in a growing number of other locations internationally, including the United States. In addition to CDC, many public health laboratories are now testing for the virus that causes COVID-19.

COVID-19: U.S. at a Glance*†

  • Total cases (1,342,594  5-12-2020) (1,324,488  5-11-20200  (1,300,696  5-10-2020) (1,274,036  5-9-2020) (1,248,040 5-8-2020) (1,219,066  5-7-2020)(1,193,813  5-6-2020) (1,171,510 5-5-2020)  (1,152,372 5-4-2020 )(1,092,815 5-2-2020)   (1,062,446  5-1-2020)(1,031,659  4-30-2020)  (1,005,147  4-28-2020) (957,875  4-27-2020) (928,619  4-26-2020)  (895,766  4-25-2020)   (865,585 4-24-2020)   (829,441   4-23-2020) (802,583  4-22-2020) (776,093 4-21-2020) (746,625 4-20-2020) (720,630 4-19-2020)  (661,712 4-17-2020)  (632,548 4-16-2020)  (605,390 4-15-2020) (579,005 4-14-2020)  (554,849 4-13-2020) (525,704 4-12-2020)  (492,416 4-11-2020)(459,165 4-10-2020) (427,460 4-9-2020) (395,011 4-8-2020)(374,329 4-7-2020) (330,891 4-6-2020) (304,826 4-5-2020) (277,205 4-4-2020) (239,279 4-3-2020) (213,144 4/2/2020)(186,101 4/1/2020) (163,539 3/31/2020) (140,904 3/30/2020)   (122,653  3-29-2020)
  • Total deaths (80,820  5-12-2020) (79,756  5-11-2020) (78,771  5-10-2020) (77,034  5-9-2020) (75,477  5-8-2020) (73,297  5-7-2020) (70,802 5-6-2020)  (68,279 5-5-2020) (67,456  5-4-2020)  (64,283  5-2-2020)  (62,405 5-1-2020)  (60,057  4-30-2020) (57,505  4-28-2020)  (53,922 4-27-2020) (52,459  4-26-2020)  (50,439 4-25-2020) (48,816  4-24-2020) (46,379 4-23-2020) (44,575 4-22-2020)  (41,759 4-21-2020) (39,083 4-20-2020)  (37,202 4-19-2020)  (33,049 4-17-2020)  (31,071 4-16-2020) (24,582 4-15-2020) (22,252 4-14-2020) (21,942 4-13-2020)  (20,486 4-12-2020)  (18,559 4-11-2020) (16,570 4-10-2020) (14,696 4-9-2020) (12,754 4-8-2020) (12,064 4-7-2020) (8,910 4-6-2020)(7,616 4-5-2020)  (6, 593 4-4-2020) (5,443 4-3-2020) (4,513 4-2-2020) (3,603 4-1-2020) (2,860 3/31/2020) (2,405 3/30/2020)   (2,112  3-29-2020)
  • Jurisdictions reporting cases: 55 (50 states, District of Columbia, Puerto Rico, Guam, Northern Marianas, and US Virgin Islands)

* Data include both confirmed and presumptive positive cases of COVID-19 reported to CDC or tested at CDC since January 21, 2020, with the exception of testing results for persons repatriated to the United States from Wuhan, China and Japan. State and local public health departments are now testing and publicly reporting their cases. In the event of a discrepancy between CDC cases and cases reported by state and local public health officials, data reported by states should be considered the most up to date.

† Numbers updated Saturday and Sunday are not confirmed by state and territorial health departments. These numbers will be modified when numbers are updated on Monday.(

Cases of COVID-19 Reported in the US, by Source of Exposure*†

* Data include both confirmed and presumptive positive cases of COVID-19 reported to CDC or tested at CDC since January 21, 2020, with the exception of testing results for persons repatriated to the United States from Wuhan, China and Japan. State and local public health departments are now testing and publicly reporting their cases. In the event of a discrepancy between CDC cases and cases reported by state and local public health officials, data reported by states should be considered the most up to date.

† CDC is no longer reporting the number of persons under investigation (PUIs) that have been tested, as well as PUIs that have tested negative. Now that states are testing and reporting their own results, CDC’s numbers are not representative of all testing being done nationwide.

Above is from:  https://www.cdc.gov/coronavirus/2019-ncov/cases-updates/cases-in-us.html

***************************************************************************************************************************************

Now being updated three times per week.

HUGE INCREASE IN PROJECTED DEATHS    For discussion go to: http://boonecountywatchdog.blogspot.com/2020/05/ihme-model-nearly-doubles-death.html

PROJECTIONS:   US COVID-19 Deaths thru 8-4-2020) (147,040  5-12-2020)  (137,184 5-10-2020) (134,475 5-4-2020)  (72,433   4-29-2020)  (74,073 4-27-2020) (65,976 4-21-2020)  (60,308 4-15-2020) (68,841 4-13-2020)  (61,543 4-10-2020) (60,415 4-8-2020) (81,766 4-5-2020) (93,531 4/3/2020) (93,765 4/1/2020)   (83.967 3/31/2020)    ( 82,141 3/30/2020);  Peak Daily    (2150 4-13-2020)

Older Peak Daily Deaths (2,212 on 4-12-2010)  (1,983 on 4-11-2020)  (2,644 on 4-16-2020)(3,130 on 4-16-2020) ( 2214 on 3/31/2020) (2,214 on 3/31/2 020) (2,271 3/30/2020)

US Population:  331 million    Projected deaths per million: 406.27

FROM:  http://www.healthdata.org/research-article/forecasting-covid-19-impact-hospital-bed-days-icu-days-ventilator-days-and-deaths Now being updated three times per week

*********************************************************************************************************************************************

COVID-19 Tracker   Great site to find specific county, state, country numbers is at:  https://bing.com/covid?form=msntrk  Site supplies case numbers, recovered cases and deaths by country and US state.

World population: 7.8  BILLION
Total confirmed cases

Updated 6 min ago

4,168,427

Active cases

2,430,356

+21,525

Recovered cases

1,452,626

+49,744

Fatal cases

285,445

+2,950