Monday, May 4, 2020

World Projections from University of Washington Study: 5-4-2020


Projections from University of Washington Study

Projected Deaths are through 8-4-2020.  Projections were supplied by IHME on 5-4--2020,

FROM:  http://www.healthdata.org/research-article/forecasting-covid-19-impact-hospital-bed-days-icu-days-ventilator-days-and-deaths
Home
All listed countries (with exception of Finland)  have sizeable increases in projected deaths.  This no doubt reflects the various changes in the IHME model.  The US death projection (406) now appears similar to these four high death rate  nations:   UK (608), Spain (590), Italy (521) and France (442).

The lower death projection countries are Greece (14), Norway (53), Finland (54), Germany (103), Denmark (140)  and Ireland (343).


***************************************************************************************************************************************************************************

United States of America—population 331 million (2020)

peak:  1,983 on 4-11-2020

Total Death Projected:  (134,475  5-4-2020)   (72,860 4-28-2020) (65,976 4-21-2020) (60,308 4-15-2020)   (68,841 4-10-2020)  (61,545 4-10-2020)

Deaths per million: 406.27

******************************************************************************************************************************************************************

UNITED KINGDOM—population 66.65 million  (2019)

peak:  ( 1,285 on  4-21-2020)1,156 on 4-13-2020

Total Death Projected (40,555 5-4-2020)  (31,476 4-28-2020)  (33,142  4-21-2020)  (37,521 4-15-2020)   (23,791 4-13-2020)  (37,494 4-10-2020)

Deaths per million: 608.48

**************************************************************************************************************************

SWEDEN—population 10.23 million (2019)

Peak:    (204 on 5-19-2020)  (127 ON 5-1-2020) on 5-8-2020

Total Death Projected (10,196 5-4-2020)  (15,625  4-28-2020)   (9191 4-21-2020) (15,890 4-15-2020)  (18,322  4-13-2020)  (13,259 4-10-2020)

Deaths per million:  996.68

*******************************************************************************************************************************

SPAIN—population 46.94 million (2019)

Peak;  950 on 4-1-2020

Total  Deaths Projected:  (27,727 5-4-2020) (25,329  4-28-2020) (24,624 4-21-2020)   (23,680 4-15-2020)  (18,713  4-13-2020)   (18,363  4-10-2020)

Deaths per million:  590.69

***************************************************************************************************************************************

NORWAY—population 5.368 million  (2019)

peak:  19 on 5-4-2020

Total Deaths Projected:  (284 5-4-2020)  (336 4-21-2020)   ( 280  4-17-2020)( 811 4-13-2020)

Deaths per million:  52,91*

*Through May4, 2020

*******************************************************************************************************************************************

ITALY—population 60.36  million (2019)

peak:  969 3-27-2020

Total Deaths Projected     (31,458 5-4-2020) (27,544  4-29-2020)  (26,600  4-21-2020) (26,007  4-17-2020) (21,130 4-13-2020) (20,333 4-10-2020)

Deaths per million:  521.17

**************************************************************************************************************************************

IRELAND—population 4.94 million  (2020)

peak:  36 on 4-7-2020

Total Deaths Projected: (1,698 5-4-2020)  (1,404  4-28-2020) (987  4-21-2020)  (890 4-17-2020)  (527  4-13-2020) (500 4-13-2020)

Deaths per million: 343,73

****************************************************************************************************************************************

GREECE—population 10.72  (2019)

peak  11 on 4-23-2020

Total Deaths Projected (152 5-4-2020)   (140  4-28-2020)  (123 4-21-2020)  (119  4-17-2020)  (374  4-13-2020)

Deaths per million:  14,18

********************************************************************************************************************************************

GERMANY—population 83.02 million  (2019)

peak:  247 on 4-12-2020

Total Deaths Projected:  (8,543  5-4-2020)  (6,946   4-28-2020)   (5913  4-21-2020)  (4,957  4-17-2020)  (7,332 4-13-2020) (7,080 4-10-2020)

Deaths per million:   102.90

*************************************************************************************************************************************************

FRANCE—population 65.27 million (2020)

peak:  920 on 4-6-202

Total Projected Deaths:   (28,859 5-4-2020)  (24,918  4-28-2020)  (23,104  4-21-2020)  (22,555  4-17-2020 )(17,448  4-13-2020)  (15,741  4-10-2020)

Deaths per million:  442.15

***************************************************************************************************************************************************

FINLAND—population 5.52  (2019)

peak 8 on 4-13-2020

Total Projected Deaths: (299 5-4-2020)  (433  4-28-2020)  (167  4-21-2020)   (118 4-17-2020)

Deaths per million:  54.17

******************************************************************************************************************************************************

DENMARK—population 5.77 (2019)

peak 45 on 5-4-2020

Total Projected deaths(806 5-4-2020)  (559 4-28-2020)  (772  4-21-2020) (683  4-17-2020)(1,669 4-13-2020)

Deaths per million:  139.67

IHME model nearly doubles death projection—now 135,000


Coronavirus model projects 135,000 deaths in US, nearly double its last estimate

By Eric Levenson, Madeline Holcombe and Arman Azad, CNN

Updated 4:07 PM ET, Mon May 4, 2020


(CNN)An influential coronavirus model often cited by the White House said in a press release that it plans to revise its projections to nearly 135,000 Covid-19 deaths in the United States, nearly double its previous prediction.

The model, from the Institute for Health Metrics and Evaluation at the University of Washington, previously predicted 72,433 deaths as of Monday morning. A press release from IHME said the full set of new projections will be released later this afternoon.

Relatedly, a Trump administration model projects a rise in coronavirus cases and deaths in the weeks ahead, up to about 3,000 daily deaths in the US by June 1, according to an internal document obtained by The New York Times. Over the past week, about 2,000 people died daily in the US, according to data from Johns Hopkins University.

The sharp increases in the two models are tied to relaxed social distancing and increased mobility in the US. States across the country -- including Florida, Colorado, Indiana, Nebraska and South Carolina -- have eased restrictions in an attempt to revive a sputtering economy and calm restless residents.

    The projections make clear that these reopenings come with fatal risks.

    "It's simple logic," CNN's senior medical correspondent Elizabeth Cohen said. "When you tell people, 'Hey, you can go to bars, you can get your nails done, you can go to a restaurant,' those numbers are going to go up."

    The novel coronavirus's incubation period -- or the time from exposure to developing symptoms -- ranges from two to 14 days, according to the CDC, and the virus can even spread among people who show no symptoms at all. With widespread testing still limited, the consequences of these reopenings may not be evident for several weeks.

    Ali Mokdad, a professor of Health Metrics Sciences at IHME, told CNN's John King on Monday that there are "several reasons" for the increased projections.


    "One of them is increased mobility before the relaxation, premature relaxation, of social distancing," he said. "We're adding more presumptive deaths as well, and we're seeing a lot of outbreaks in the Midwest, for example."

    He said multiple variables impact infections -- like heat, testing capacity and population density -- but "the most important one is mobility."

    Right now, he said, "we're seeing an increase in mobility that's leading to an increase in mortality, unfortunately, in the United States."

    Coronavirus has killed 68,285 people in the US and infected more than 1,171,000 others, according to data from Johns Hopkins University.

    President Donald Trump had previously said he expected 65,000 Americans to die, but on Sunday night, he revised that estimated death toll up to 80,000-90,000 people. It may not be the last upward revision; Dr. Deborah Birx, a White House coronavirus task force official, said projections have shown between 100,000 to 240,000 American deaths, even with social distancing.

    …..

    Above is from: https://www.cnn.com/2020/05/04/health/us-coronavirus-monday/index.html

    CDC: What are other models projecting?

    COVID-19 Forecasts

    Below is from:  https://www.cdc.gov/coronavirus/2019-ncov/covid-data/forecasting-us.html


    Updated May 1, 2020

    On This Page

    Why Forecasting COVID-19 Deaths in the US is Critical

    CDC is responding to a pandemic of coronavirus disease 2019 (COVID-19) caused by a novel coronavirus, SARS-CoV-2, that is spreading from person to person. The federal government is working closely with state, tribal, local, and territorial health departments, and other public health partners, to respond to this situation.  Forecasts of deaths will help inform public health decision-making by projecting the likely impact in coming weeks.

    What the Forecasts Aim to Predict

    Forecasts based on the use of statistical or mathematical models (subsequently referred to as “models”) aim to predict changes in national- and state-level cumulative reported COVID-19 deaths for the next four weeks. Forecasting teams predict numbers of deaths using different types of data (e.g., COVID-19 data, demographic data, mobility data), methods (see below), and estimates for the impacts of interventions (e.g. social distancing, use of face coverings).

    Interpretation of Forecasts

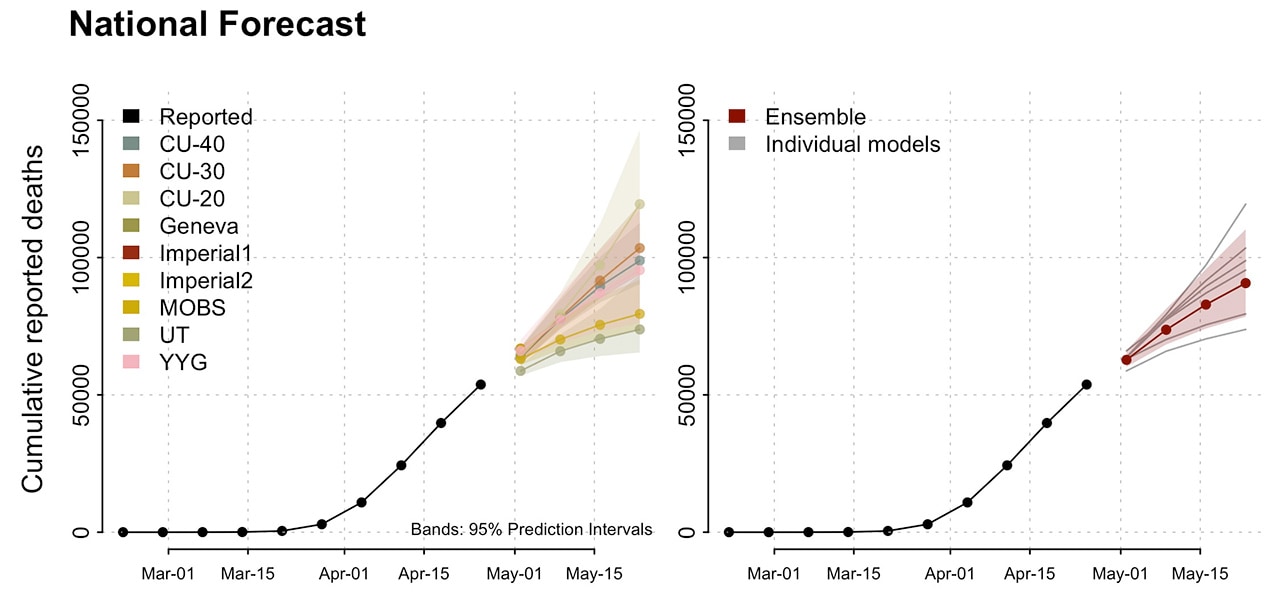
    • This week’s forecasts include national- and state-level forecasts from additional modeling groups and “ensemble” forecasts that summarize the information from the individual forecasts.
    • National-level forecasts continue to indicate that deaths are likely to rise in the coming weeks. How quickly they will increase remains uncertain and is dependent on forecast assumptions about the strength and coverage of social distancing behaviors that continue over this period.
    • State-level ensemble forecasts (only shown for states and territories with at least two forecasts) indicate a slowed growth in new deaths for most states.

    National Forecast

    National Forecast as of April 27, 2020

    • These forecasts show cumulative reported COVID-19 deaths since February and forecasted deaths for the next four weeks in the United States.
    • The CU models make various assumptions about the effectiveness of current interventions. All other models assume that existing social distancing measures will continue through the time period shown.

    State Forecasts

    State level forecasts show observed and forecasted state level cumulative COVID-19 deaths in the US.

    Forecasts fall into one of three categories

    • The LANL and UMass-MB models do not explicitly model the effects of individual social distancing measures but assume that implemented interventions will continue, resulting in decreased growth.
    • The Geneva, MIT, MOBS, UT, and YYG models are conditional on existing social distancing measures continuing through the projected time period.
    • The CU models make different assumptions about the effectiveness of current social distancing interventions.

    Download state forecasts pdf icon[PDF – 186 KB]

    Download model data excel icon[XLS – 396 KB]

    Working to Bring Together Forecasts for COVID-19 Deaths in the US

    CDC works with partners to bring together weekly forecasts for COVID-19 deaths in one place. These forecasts have been developed independently and shared publicly. It is important to bring these forecasts together to help understand how they compare with each other and how much uncertainty there is about what may happen in the upcoming four weeks.

    Columbia University external icon

    Model names: CU 20% contact reduction, CU 30% contact reduction, CU 40% contact reduction

    Intervention assumptions
    These models are based on assumptions of reducing the number of contacts per case. Three different adaptive scenarios of contact reduction are projected: 20%, 30%, and 40% contact reduction in US counties with at least 10 cases. Additional reductions are implemented with additional new cases, and all social distancing interventions remain in place until the end of the projection.

    Methods
    Metapopulation SEIR model

    Imperial College, London external icon

    Model names: Imperial1, Imperial2

    Intervention Assumptions:

    These projections do not make any specific assumptions about which interventions have been or will remain in place.

    Methods: Ensembles of mechanistic transmission models, fit to different parameter assumptions.

    Los Alamos National Laboratory (state-level forecasts only)external icon

    Model name: LANL

    Intervention assumptions
    Currently implemented interventions and the corresponding reductions in transmission will continue, resulting in an overall decrease in the growth rate of COVID-19. Over the course of the forecast, the model assumes that the growth will decrease over time.

    Methods
    Statistical dynamical growth model accounting for population susceptibility

    Massachusetts Institute of Technology external icon

    Model names: MIT

    Intervention Assumptions: The projections assume that current interventions will remain in place indefinitely.

    Methods: SEIR model fit to reported death and case counts.

    Northeasterne xternal icon

    Model name: MOBS (Laboratory for the Modeling of Biological + Socio-technical Systems)

    Intervention assumptions
    The projections assume that social distancing policies in place at the date of calibration are extended for the future weeks.

    Methods
    Metapopulation, age-structured SLIR model

    University of Geneva (one-week ahead forecasts only)external icon

    Model name: Geneva

    Intervention assumptions
    The projections assume that social distancing policies in place at the date of calibration are extended for the future weeks.

    Methods
    Exponential and linear statistical models fit to the recent growth rate of cumulative deaths.

    University of Massachusetts, Amherstexternal icon

    Model name: UMass-MB

    Intervention assumptions
    These projections do not make any specific assumptions about which interventions have been or will remain in place.

    Methods: Mechanistic Bayesian compartment model.

    University of Texas, Austinexternal icon

    Model name: UT

    Intervention assumptions
    Estimates the extent of social distancing using geolocation data from mobile phones and assumes that the extent of social distancing does not change during the period of forecasting. The model is designed to predict confirmed COVID-19 deaths resulting from only a single wave of transmission.

    Methods
    Nonlinear Bayesian hierarchical regression with a negative-binomial model for daily variation in death rates.

    Youyang Gu (COVID-Projections)external icon

    Model name: YYG

    Intervention assumptions
    The projections assume that strong social distancing policies will remain in place through the projected period.

    Methods
    SEIS mechanistic model.

    Additional Resources:

    May 4: 63,840 COVID-19 cases in Illinois


    In response to the COVID-19 pandemic, Gov. JB Pritzker has ordered Illinois residents to stay at home. Executive Order No. 10 requires all residents to stay home, with exceptions for essential needs or business activities. Gatherings of 10 people or more are prohibited. The order extends through May 30, 2020.
    COVID-19 Statistics
    Positive (Confirmed)
    63,840  +2,341
    Deaths
    2,662   +44 
    Total Tests Performed*
    319,313  +13,724
    Total Cases
    (63,840  5-4-2020) (61,499 5-3-2020) (58,505  5-2-2020)  56,055 5-1-2020) (52,918  4-30-2020) (50,355  4-29-3030) (48,102 4-28-2020) (45,883  4-27-2020) (43,903  4-26-2020) ( 41,777  4-25-2020) (39,658  4-24-2020)  (36,934 4-23-2020)  (35,108 4-22-2020)(33,059  4-21-2020) (31,508  4-20-2020) (30,357 4-19-2020)  (29,160  4-18-2020)  (27,575  4-17-2020) (25,733  4-16-2020)  (24,593 4-15-2020)  (23,247 4-14-2020)  (22,025 4-13-2020)  (20,852 4-12-2020) (19,180 4-11-2020 ) (17,887 4-10-2020) (16,422 4-9-2020) (15,078 4-8-2020) (13,549 4-7-2020) (12,262 4-6-2020) (11,256 4-5-2020) (10,357 4/4/2020) (8,904-- 4/3/2020) (7,695-- 4/2/2020)   (6,980-- 4/1/2020) (5,994-- 3/31/2020)  (5,05--7 3/30/2020) (4,596-- 3/29/2020)


    Deaths

    (2662 5-4-2020) (2,618 5-3-2020) (2,559 5-2-2020) (2,457 5-1-2020) (2,355  4-30-2020) (2,215  4-29-2020)  (2,125  4-28-2020) (1,983  4-27-2020) (1,933 4-26-2020 )(1,874  4-25-2020) 1,795  4-22-2020) (1,688  2-23-2020) (1,585 4-22-2020) (1,468  4-21-2020) (1,349 4-20-2020)(1,290 4-18-2020)  (1,259  4-18-2020) (1,134  4-17-2020) (1,072  4-16-2020) (948 4-15-2020)  (866 4-14-2020) (794 4-13-2020)  (720 4-12-2020) (677 4-11-2020)(596 4-10-2020) (528 4-9-2020) (462 4-8-2020) (380 4-7-2020)(307 4-6-2020) (274 4-5-2020) (243—4-4-2020) (210-- 4-3-2020) (157 4-2-2020)(141 4/1/2020) (99 3/31/2020) (73 3/30/2020)  (65 3/29/2020)
    Total Persons Tested*
    (333,147  5-4-2020) (319,313  5-3-2020) (299,892 5-2-2020)  (284,688  5-1-2020) (269,867 4-30-2020) (256,667  4-29-2020) (242,189  4-28-2020) (227,628  4-27-2020) (214,952 4-26-2020) (201,617 4-25-2020) (186,219  4-24-2020)(173,316 4-23-2020) (164,346 4-22-2020)  (154,997  4-21-2020) (148,358 4-20-2020) (143,318 4-19-2020)  (137,404  4-18-2020) (130,163  4-17-2020)  (122,589  4-16-2020)  (116,929 4-15-2020) (110,616 4-14-2020)  (105,768 4-13-2020) (100,735 4-12-2020) (92,779 4-11-2020) (87,527 4-10-2020) (86,857 4-9-2020) (75,066 4-8-2020) (68,732 4-7-2020) (62,942 4-6-2020) (58,983 4-5-2020) (53,581—4-4-2020)  (48,048-- 4-3-2020) (43,653-- 4/2/2020) (40,384-- 4/1/2020) (35,225-- 3-31-2020) (30,446-- 3/30/2020)  (27,762-- 3/29/2020)

    *Total number of people reported electronically for testing of COVID-19 at IDPH, commercial or hospital laboratories. Deaths are included in the number of positive cases
    All numbers displayed are provisional and subject to change.

    Information to be updated daily.

    Above is from: http://www.dph.illinois.gov/covid19/covid19-statistics

    *****************************************************************************************************************************

    Home


    PROJECTIONS from:  http://www.healthdata.org/research-article/forecasting-covid-19-impact-hospital-bed-days-icu-days-ventilator-days-and-deaths Now being updated three times per week.

    HUGE INCREASE IN PROJECTED DEATHS    For discussion go to:  http://boonecountywatchdog.blogspot.com/2020/05/ihme-model-nearly-doubles-death.html

    Total COVID-19 deaths projected through August 4, 2020 in Illinois (6,353  5-4-2020)  (2,337  4-29-2020)   (2,316 4-27-2020)  (2093 4-21-2020) (2,259 4-15-2020) (1248 4-13-2020)

    (777 4-10-2020)  (1,584  4-8-2020) (3,629 4-5-2020)(3,386 4-2-2020) (2,789 4-1-2020)  (2,326  3-31-2020)  (2,369 as of 3/30/2020)  (2,454 AS OF 3-26-2020)

    COVID-19 deaths   Peak deaths  (95 deaths on 4-19-2020)               Previously (91 deaths on 4-12-2020)  (208 on 4-12-2020) (109 on 4-20-2020)

    Illinois Population:  12.74 million        Projected deaths per million: 498,67

    For a lengthier discussion of the projection model go to:  http://boonecountywatchdog.blogspot.com/2020/03/forecasting-covid-19-impact-on-hospital.html and http://boonecountywatchdog.blogspot.com/2020/05/why-imhs-corvid-19-model-is-so-wrong.html

    BOONE COUNTY


    **************************************************************************************************************************************************************

    This page summarizes the latest data for COVID-19 in McHenry County. This data is provisional and subject to change.

    McHenry County

    McHenry County Cases


    McHenry County Cases


    798

    Source: McHenry County Department of Health

    McHenry County Deaths


    42

    Source: McHenry County Department of Health


    Above is from:  https://mchenry-county-coronavirus-response-mchenrycountygis.hub.arcgis.com/

    *************************************************************************************************************************************************************************

    By WIFR Newsroom |

    Posted: Mon 4:02 PM, May 04, 2020  |

    Updated: Mon 4:38 PM, May 04, 2020

    WINNEBAGO COUNTY, Ill. (WIFR) -- At the Monday COVID-19 press briefing, county health officials announced more positive cases and more tests have been completed.

    According to Dr. Sandra Martell of the Winnebago County Health Department, she says that 6,900 tests have been administered so far in the county for COVID-19. 16.2% of the tests have come back positive. 3,162 tests have come back negative and 3,107 tests are still pending.

    54 new cases were also announced by health officials, bringing the county total to 616 positive cases. 2/3 of the confirmed cases in Winnebago County, Martell says, come from 'areas of concern' in the county.

    Areas of concern are the following:

    -- Alden Alma Nelson Manor
    -- Amberwood Care Centre
    -- Anam Care
    -- East Bank Center
    -- Forest City Rehab & Nursing
    -- Goldie B Floberg Center
    -- Milestone
    -- Peterson Meadows
    -- River Bluff Nursing Home
    -- Rockford Rescue Mission
    -- Van Matre
    -- Winnebago County Jail

    Location of concerns can be removed off the list after 0 new cases in 28 days, said Dr. Martell.

    1 new death was announced over the last 24 hours, the total now at 22.

    Here is the breakdown of cases in the county by age group:

    -- 24 cases: 0-9 age group
    -- 37 cases: 10-19 age group
    -- 127 cases: 20-29 age group
    -- 119 cases: 30-39 age group
    -- 96 cases: 40-49 age group
    -- 99 cases: 50-59 age group
    -- 62 cases: 60-69 age group
    -- 27 cases: 70-79 age group
    -- 25 cases: 80 and older age group

    Here is the breakdown of the cases in the county by race ethnicity:

    -- 23%: White. Not Hispanic or Latino
    -- 22%: Black/African American, Not Hispanic or Latino
    -- 15%: Hispanic or Latino
    -- 3%: Asian, Not Hispanic
    -- 37%: Unknown

    The health department also reports that 107 people have recovered from the novel coronavirus, up 6 from yesterday.

    Dr. Martell also emphasized that the most cases of confirmed COVID-19 cases are in the 20-29 age group saying the group is, "the one inching to get out each day."

    Above is from:  https://www.wifr.com/content/news/Winnebago-County-announces-54-new-COVID-19-cases-total-surpasses-600.html


    **********************************************************************************************************************************************

    Cases in U.S.

    Updated  May 4, 2020
    U.S. At A Glance

    As of May 3, 2020

    Total Cases*

    1,152,372

    Total Deaths

    67,456   This page will be updated daily. Numbers close out at 4 p.m. the day before reporting.

    ***On Saturday and Sunday, the numbers in COVID-19: U.S. at a Glance and the figure describing the cumulative total number of COVID-19 cases in the United States will be updated. These numbers are preliminary and have not been confirmed by state and territorial health departments. CDC will update weekend numbers the following Monday to reflect health department updates.***

    CDC is responding to an outbreak of respiratory illness caused by a novel (new) coronavirus. The outbreak first started in Wuhan, China, but cases have been identified in a growing number of other locations internationally, including the United States. In addition to CDC, many public health laboratories are now testing for the virus that causes COVID-19.

    COVID-19: U.S. at a Glance*†

    • Total cases (1,152,372 5-4-2020 )(1,092,815 5-2-2020)   (1,062,446  5-1-2020)(1,031,659  4-30-2020)  (1,005,147  4-28-2020) (957,875  4-27-2020) (928,619  4-26-2020)  (895,766  4-25-2020)   (865,585 4-24-2020)   (829,441   4-23-2020) (802,583  4-22-2020) (776,093 4-21-2020) (746,625 4-20-2020) (720,630 4-19-2020)  (661,712 4-17-2020)  (632,548 4-16-2020)  (605,390 4-15-2020) (579,005 4-14-2020)  (554,849 4-13-2020) (525,704 4-12-2020)  (492,416 4-11-2020)(459,165 4-10-2020) (427,460 4-9-2020) (395,011 4-8-2020)(374,329 4-7-2020) (330,891 4-6-2020) (304,826 4-5-2020) (277,205 4-4-2020) (239,279 4-3-2020) (213,144 4/2/2020)(186,101 4/1/2020) (163,539 3/31/2020) (140,904 3/30/2020)   (122,653  3-29-2020)
    • Total deaths (67,456  5-4-2020)  (64,283  5-2-2020)  (62,405 5-1-2020)  (60,057  4-30-2020) (57,505  4-28-2020)  (53,922 4-27-2020) (52,459  4-26-2020)  (50,439 4-25-2020) (48,816  4-24-2020) (46,379 4-23-2020) (44,575 4-22-2020)  (41,759 4-21-2020) (39,083 4-20-2020)  (37,202 4-19-2020)  (33,049 4-17-2020)  (31,071 4-16-2020) (24,582 4-15-2020) (22,252 4-14-2020) (21,942 4-13-2020)  (20,486 4-12-2020)  (18,559 4-11-2020) (16,570 4-10-2020) (14,696 4-9-2020) (12,754 4-8-2020) (12,064 4-7-2020) (8,910 4-6-2020)(7,616 4-5-2020)  (6, 593 4-4-2020) (5,443 4-3-2020) (4,513 4-2-2020) (3,603 4-1-2020) (2,860 3/31/2020) (2,405 3/30/2020)   (2,112  3-29-2020)
    • Jurisdictions reporting cases: 55 (50 states, District of Columbia, Puerto Rico, Guam, Northern Marianas, and US Virgin Islands)

    * Data include both confirmed and presumptive positive cases of COVID-19 reported to CDC or tested at CDC since January 21, 2020, with the exception of testing results for persons repatriated to the United States from Wuhan, China and Japan. State and local public health departments are now testing and publicly reporting their cases. In the event of a discrepancy between CDC cases and cases reported by state and local public health officials, data reported by states should be considered the most up to date.

    † Numbers updated Saturday and Sunday are not confirmed by state and territorial health departments. These numbers will be modified when numbers are updated on Monday.(

    Cases of COVID-19 Reported in the US, by Source of Exposure*†

    * Data include both confirmed and presumptive positive cases of COVID-19 reported to CDC or tested at CDC since January 21, 2020, with the exception of testing results for persons repatriated to the United States from Wuhan, China and Japan. State and local public health departments are now testing and publicly reporting their cases. In the event of a discrepancy between CDC cases and cases reported by state and local public health officials, data reported by states should be considered the most up to date.

    † CDC is no longer reporting the number of persons under investigation (PUIs) that have been tested, as well as PUIs that have tested negative. Now that states are testing and reporting their own results, CDC’s numbers are not representative of all testing being done nationwide.

    Above is from:  https://www.cdc.gov/coronavirus/2019-ncov/cases-updates/cases-in-us.html

    ***************************************************************************************************************************************

    Now being updated three times per week.

    HUGE INCREASE IN PROJECTED DEATHS    For discussion go to:  http://boonecountywatchdog.blogspot.com/2020/05/ihme-model-nearly-doubles-death.html

    PROJECTIONS:   US COVID-19 Deaths thru 8-4-2020) (134,475  5-4-2020)  (72,433   4-29-2020)  (74,073 4-27-2020) (65,976 4-21-2020)  (60,308 4-15-2020) (68,841 4-13-2020)  (61,543 4-10-2020) (60,415 4-8-2020) (81,766 4-5-2020) (93,531 4/3/2020) (93,765 4/1/2020)   (83.967 3/31/2020)    ( 82,141 3/30/2020);  Peak Daily    (2150 4-13-2020)

    Older Peak Daily Deaths (2,212 on 4-12-2010)  (1,983 on 4-11-2020)  (2,644 on 4-16-2020)(3,130 on 4-16-2020) ( 2214 on 3/31/2020) (2,214 on 3/31/2 020) (2,271 3/30/2020)

    US Population:  331 million    Projected deaths per million: 406.27

    FROM:  http://www.healthdata.org/research-article/forecasting-covid-19-impact-hospital-bed-days-icu-days-ventilator-days-and-deaths Now being updated three times per week

    *********************************************************************************************************************************************

    COVID-19 Tracker   Great site to find specific county, state, country numbers is at:  https://bing.com/covid?form=msntrk  Site supplies case numbers, recovered cases and deaths by country and US state.

    World population: 7.8  BILLION

    Total confirmed cases

    Updated 8 min ago

    3,578,301

    Active cases

    2,164,963

    +38,023

    Recovered cases

    1,162,279

    +38,152

    Fatal cases

    251,059

    +3,952

    Sunday, May 3, 2020

    BCJ Editorial–May 1, 2020

    Boone County Journal -
        Regional Newspaper Providing News for Boone County, Belvidere,
        and Northern Illinois.


    “When somebody is president of the United States, the authority

    is total.”

    DONALD J. TRUMP, APRIL 13, 2020

    Enough is enough.

    This newspaper concerns itself with the affairs of Boone County, Illinois and neighboring communities.

    Our mission is the betterment of Belvidere, and the villages surrounding it.

    Although this newspaper has been outraged by the antics of President Donald J. Trump during the past

    three-plus years, we have held our tongues, even when Mr. Trump was impeached. Consistent with our

    mission as a local newspaper, we have publicly condemned the Trump Administration on only three

    occasions:

     Mr. Trump’s attack on the health care of Boone Countians.

     Mr. Trump’s bigoted remarks and those of his Vice President and Attorney General, which affect

    the well-being and safety of Boone Countians of color.

     Mr. Trump’s threats against the employees of the National Weather Service, who warned against

    Trump’s ridiculous claim that Hurricane Dorian was a threat to Alabama. The National Weather

    Service keeps Boone County apprised in the event of threatening weather, and an attack against

    their integrity is an attack against us.

    After Donald J. Trump’s claim of “total authority” on Monday, April 13, Mr. Trump sent three messages via

    the Twitter service four days later on Friday, April 17, directing his sycophants to “LIBERATE

    MINNESOTA”, “LIBERATE MICHIGAN” and “LIBERATE VIRGINIA, and save your great 2nd

    Amendment.” Not surprisingly, demonstrators attempted to blockade the Michigan State Capitol and

    brandished semiautomatic firearms.

    This is the very definition of sedition.

    With the words “Real journalism for a real democracy” appearing in every issue of this newspaper for the

    past twenty-four years, we cannot allow these chilling, dangerous, and outrageous utterances to stand

    unchecked.

    While Mr. Trump’s devoted disciples will justify these statements as “Just Trump being Trump,” we ask

    them where is the line between “Trump being Trump” and a serious violation of President Trump’s oath of

    office to defend the Constitution of the United States. The separation of powers is a sacred hallmark of

    the American system of government. This nation was specifically founded on the rejection of monarchial,

    dictatorial rule. Words do matter, and so do deeds.

    Donald J. Trump’s statements on April 13 and April 17, 2020 disqualify him from serving as President of

    the United States.

    This nation, and indeed the world, finds itself in time of peril. A deadly, highly contagious virus is gripping

    the entire planet. This pandemic has, in a few short months, killed many, and taken multiple lives in

    Boone and McHenry Counties. The grim forecast includes the death of millions more and threatens to

    ravage the world’s economy as well. Bread lines have formed in Boone County and elsewhere.

    This is a time when we need leadership. Many have risen to the cause, and are doing their utmost to

    preserve lives. Countless others worldwide have practiced social distancing, often accompanied by great

    personal sacrifice. Others, like President Trump, have treated this as a political opportunity. Governors

    of states who are trying to save lives have found the need to coddle Mr. Trump’s fragile ego and his need

    for continuous praise in order to obtain the lifesaving equipment residents of their states deserve. The

    video and audio record of Mr. Trump speaks for itself.

    Mr. Trump is incapable of admitting even the slightest of his mistakes, is devoid of empathy for anyone

    but himself, cannot contain his temper, and is a habitual liar. Again, these charges are well-documented

    by widely accessible video records of Donald J. Trump’s conduct. These are not the qualities of an

    effective leader.

    Despite it being a lie worthy of Pinocchio, and a videotape to the contrary, we will suspend disbelief and

    assume that Mr. Trump was indeed being “sarcastic” when he proposed injecting disinfectants last week

    on April 24. We ask his acolytes and other supporters if “sarcasm” is appropriate at a time when 50,000

    Americans have lost their lives to the coronavirus, with unquestionably many more obituaries to come.

    Sympathy cards have become difficult to find in the card racks of many communities. We ask our

    Republican friends who back Donald J. Trump if they would have found it appropriate for Lyndon Johnson

    to have been “sarcastic” over the deaths of American soldiers in Vietnam. The American casualties of

    coronavirus have already surpassed the American death toll from that conflict.

    We are not going to blame Donald J. Trump for the coronavirus, nor the obvious initial mismanagement of

    the crisis in China, whether or not that occurred in Hubei Province or by the Government in Beijing. But

    we do believe that Mr. Trump’s denials, unpreparedness, and lack of aggressive action has made the

    crisis worse. Mr. Trump may personally thrive on creating chaos, but chaos, as entertaining as some of

    his supporters may find it, is not in the best interests of the people of the United States or the rest of the

    world. Nor is it appropriate for someone the likes of that to have the codes to launch a nuclear war.

    For these reasons, we find Donald J. Trump unfit for public office.

    Isn’t it time to stop making excuses for Donald J Trump?

    We ask those who still support him—to be quite blunt—is it your hatred for minorities (clandestine or

    otherwise), resentment of “elites,” and/or your “right” to brandish semi-automatic weapons on the grounds

    of a state capitol that is so central to your personage that you are willing to support Donald J. Trump no

    matter how he behaves? Are there any limits? When is enough enough?

    Republicans do us a disservice. A recent survey by the Pew Research Center noted that 41 percent of

    Democratic registered voters are not happy with a Democratic nominee for the 2020 election being a

    “white man in his 70s”.

    Republicans should nominate someone other than Donald J. Trump in Charlotte. Of course, Mike Pence

    is a joke, but what about Marco Rubio, John Kasich, or Mitt Romney? What if Republicans actually

    nominated someone who gave Democrats a plausible option to abandon Joe Biden? While Mr. Biden is

    not nearly as odious as Mr. Trump, his record troubles us, and we find him one of the least desirable of

    this year’s crop of Democratic candidates. At the Democratic County Chairmen’s Breakfast this past

    summer, there was no support among the party faithful for Joe Biden. We’ve attended a number of other

    partisan functions where the enthusiasm for Mr. Biden was no greater. But, with a candidate like Donald

    J. Trump as their nominee, the Republicans are as culpable as the Democratic National Committee

    operatives in shoving the unwanted Joe Biden in reasonable voters’ faces.

    We expect that Donald J. Trump will be the Republicans’ nominee. That’s too bad. We need a president

    who will be there for us in the next four years, not a seditious liar. America could use a miracle in both

    Milwaukee and Charlotte this summer.

    We are not going to dwell on this issue. Perhaps we should. We are in for some difficult times. Instead,

    we intend to stick to our central issue, the future prosperity of Boone County. Our community has

    become a very stagnant place, with a number of serious challenges. For its own good, the “business as

    usual” attitude in Boone County needs to change

    Why IHME’s Corvid-19 model is so wrong?

    White House Coronavirus Task Force coordinator Deborah Birx discusses a model that estimates US coronavirus cases and deaths on March 31. Mandel Ngan/AFP/Getty Images

    This coronavirus model keeps being wrong. Why are we still listening to it?

    A model that the White House has relied on has come under fire for its flawed projections.

    By Kelsey Piper May 2, 2020, 8:00am EDT


    How many people are likely to die in the United States of Covid-19? How many hospital beds is the country going to need? When will case numbers peak?

    To answer those questions, many hospital planners, media outlets, and government bodies — including the White House — relied heavily on one particular model out of the many that have been published in the past two months: the University of Washington’s Institute for Health Metrics and Evaluation (IHME).

    The model first estimated in late March that there’d be fewer than 161,000 deaths total in the US; in early April, it revised its projections to say the total death toll through August was “projected to be 60,415” (though it acknowledged the range could be between 31,221 and 126,703).

    The model has been cited often by the White House and has informed its policymaking. But it may have led the administration astray: The IHME has consistently forecast many fewer deaths than most other models, largely because the IHME model projects that deaths will decline rapidly after the peak — an assumption that has not been borne out.

    On Wednesday, the US death count passed the 60,000 mark that the IHME model had said was the likely total cumulative death toll. The IHME on April 29 released a new update raising its estimates for total deaths to 72,433, but that, too, looks likely to be proved an underestimate as soon as next week. Even its upper bound on deaths — now listed as 114,228 by August — is questionable, as some other models expect the US will hit that milestone by the end of May, and most project it will in June.

    One analysis of the IHME model found that its next-day death predictions for each state were outside its 95 percent confidence interval 70 percent of the time — meaning the actual death numbers fell outside the range it projected 70 percent of the time. That’s not great! (A recent revision by IHME fixed that issue; more on this below.)

    This track record has led some experts to criticize the model. “It’s not a model that most of us in the infectious disease epidemiology field think is well suited” to making projections about Covid-19, Harvard epidemiologist Marc Lipsitch told reporters.

    But if that’s the case, how has it risen to such prominence among policymakers? Other models have done better than IHME’s at predicting the course of the epidemic, and many of them use approaches epidemiologists believe are more promising. Yet it’s the IHME model that has generally guided policymakers, for the most part, in the direction of focusing on a return to normal.

    One potential explanation for its outsize influence: Some of the factors that make the IHME model unreliable at predicting the virus may have gotten people to pay attention to it. For one thing, it’s more simplistic compared to other models. That means it can be applied in ways more complicated models could not, such as providing state-level projections (something state officials really wanted), which other modelers acknowledged that they didn’t have enough data to offer.

    Meanwhile, its narrow confidence intervals for state-by-state estimates meant it had quotable (and optimistic) topline numbers. A confidence interval represents a range of numbers wherein the model is very confident the true value will lie. A narrow range that gives “an appearance of certainty is seductive when the world is desperate to know what lies ahead,” a criticism of the IHME model published in the Annals of Internal Medicine argued. But the numbers and precise curves the IHME is publishing “suggests greater precision than the model is able to offer.”

    The criticism of the IHME model, and an emerging debate over epidemiology models more broadly, has brought to light important challenges in the fight against the coronavirus. Good planning requires good projections. Models are needed to help predict resurgences and spot a potential second wave. Dissecting what the IHME model got wrong, what other models got right, and how the public and policymakers read these models is essential work in order to create the best pandemic plans possible.

    What’s wrong with the IHME model of the coronavirus?

    Models of disease spread are meant to help decision-makers in an environment where math will outperform intuitions. Most people have a hard time thinking about exponential growth, which is why many were taken by surprise in March as the virus spread. That’s why models can be useful.

    Models usually lay out some foundational assumptions and offer projections based on those assumptions. The IHME model seeks to project death rates and hospitalization rates assuming widespread social distancing and strong measures to prevent the spread of the virus. Since testing is so unreliable at identifying the infection rate, the model uses only death rates as data (though evidence from all-cause mortality data suggests we’re undercounting coronavirus-caused deaths, too).

    That projected hospitalization rate was one of the things that set it apart, IHME researcher Ali Mokdad told me. It was one of the few models offering that projection, and it was actionable information governments could grab on to and plan around.

    Another reason it rose in prominence was IHME’s decision to model the effects of strong social distancing measures. That choice proved correct — strong measures were indeed taken across the US — and the lower death numbers the model churned out as a result reportedly led to it being received favorably by the Trump administration.

    But as the weeks have passed, it has become clear that the IHME’s projections have been too optimistic, and slow to adjust to reflect the fact that deaths have plateaued rather than rapidly decreasing to zero. The IHME has been regularly updating its model as new data comes in, but the updates have often been slow enough that the numbers are absurd by the time they’re changed in an update. For example, in late April the model still stated the expected total death toll was 60,000, even as the US was clearly only a few days from that milestone.

    Mokdad told me when we talked that a fix was in the works, and it went up a few days later: The model now projects 73,433 deaths by August. That, too, is probably an underestimate — most other models project that total will be reached next week.

    In the IHME’s defense, it does offer a 95 percent confidence interval that is more accurate than the topline numbers. That range goes from 59,343 — significantly less than the number of people already dead of the virus — to 114,228. That might sound like a wide range, but it’s still optimistic, and the actual toll is on track to lie outside that range entirely. MIT projects the US will surpass that upper bound in mid-June, and the Los Alamos forecast, like the MIT one, predicts the country will burst through the IHME’s 95 percent confidence interval in around six weeks.

    That’s one of the core complaints about the IHME model: its confidence intervals seem too narrow, both for its next-day and several-months-ahead predictions. For instance, when used to predict the number of deaths in a state the very next day (which doesn’t require any complex modeling of the long-term effects of uncertain policies), other researchers found the true deaths were outside of the 95 percent confidence interval given by the model 70 percent of the time. Those are embarrassingly poor results.

    The day-to-day numbers are jumpy because some counties don’t report numbers every day, Mokdad told me. “The model is kind of confused because states are not reporting deaths consistently,” he said, adding, “The model assumes deaths will increase and then come back down,” and so it reacts poorly when deaths instead vary day to day. Smoothing over the course of a week — the latest update the IHME team made — means the model should be more predictive.

    Indeed, the latest update to the model solves the problem where the next-day deaths are usually outside the model’s confidence interval by giving the model extremely wide confidence intervals. That’s commendable. It is better to be honest about your extremely high uncertainty than to claim certainty you don’t have.

    That might lead to unsatisfying models with extremely wide ranges — 176 to 3,885 deaths today — but if that’s an accurate reflection of the state of uncertainty, then so be it. It’s better to have a wide confidence interval, acknowledging your uncertainty, than to have a narrow one that is usually wrong. And if next-day deaths are usually wrong, as IHME’s are, that undermines confidence in the long-term predictive value of the model.


    (But while the IHME has made its day-to-day confidence intervals larger, it still has very narrow confidence intervals for its projections several weeks into the future — which is odd, as there should be even more uncertainty about those.)

    An even bigger issue with the IHME model is that the way the model is published can obscure its problems. When it’s updated, it can be hard to see what its old, obviated predictions were. A website, covid-projections.com, has been set up so that you can look at the predictions made by old versions of the IHME model (and at the history of other models). The IHME models are frequently fairly far off.

    The IHME model is unusual compared to other epidemiological models for its design, too. While most of the models use standard epidemiology modeling tactics like SEIR (susceptible-exposed-infected-recovered modeling) or use computer simulations, the IHME model is effectively just about fitting a curve from early data in China and Italy to the disease’s trajectory elsewhere.

    The IHME model is based “on a statistical model with no epidemiologic basis,” the Annals of Internal Medicine critique argues.

    The IHME team has defended its model against those complaints.

    “We’re willing to make a forecast. Most academics want to hedge their bets and not be found to ever be wrong,” IHME director Christopher Murray told Politico. “That’s not useful for a planner — you can’t go to a hospital and say you might need 1,000 ventilators, or you might need 5,000.”

    The model has gotten better, but flaws remain

    The change to the model has certainly improved it, but some problems with the confidence intervals remain. The new model acknowledges extremely high uncertainty about what will happen tomorrow — in my state, California, it says there will be between 5 and 103 deaths tomorrow. That’s a really wide range.

    But on May 20, the model is entirely sure there will be zero deaths. The 95 percent confidence interval runs from zero deaths to ... zero deaths.

    The IHME’s model of deaths in California reports lots of uncertainty about what will happen tomorrow but extremely high confidence about what will happen in late May.

    That’s an extremely strong claim. I pressed the IHME team about whether they were sure of it. Mokdad said the model’s zero-deaths predictions were correct: “Based on the graph, in certain states, yes — in California, May 17, zero. The virus is not circulating anymore; you would expect it to go to zero.”

    But the virus is still circulating in California. On April 28, there were 1,187 new cases reported in the state. Even if all infections in California stopped instantly today, it is likely that some already infected people would die in mid-May or later.

    California’s case numbers (like those of many states) are declining, but only slowly, as social distancing has limited the spread of the virus but not fully stopped it. That ties into another problem with the IHME model: It assumes that social distancing measures, once put in place, are always sufficient to rapidly decrease case numbers to zero.

    In the report explaining the model, the researchers write that they look at four measures: “School closures, non-essential business closures including bars and restaurants, stay-at-home recommendations, and travel restrictions including public transport closures. Days with 1 measure were counted as 0.67 equivalents, days with 2 measures as 0.334 equivalents and with 3 or 4 measures as 0.”

    In other words, the model has a built-in assumption that once three of those measures have been put into place, cases will rapidly fall to zero. No new data can change that assumption, which is why the model continues to project zero deaths by mid-May in any area that hasn’t lifted social distancing restrictions, even though case numbers have only plateaued rather than declined in many areas.

    There are many similar frustratingly confident predictions: On July 12, the model says, we’ll need between 0 and 12 hospital beds in the whole US for coronavirus patients, and there will be 0 deaths at any point after July 12.

    Why the IHME model’s problems shouldn’t be used as an indictment of epidemiology more broadly

    All these concerns make it frustrating to many epidemiologists that the IHME model is the one being widely used and cited. “That the IHME model keeps changing is evidence of its lack of reliability as a predictive tool,” epidemiologist Ruth Etzioni told Stat News in an article about the problems with the model. “That it is being used for policy decisions and its results interpreted wrongly is a travesty unfolding before our eyes.”

    Alex Merz, a microbiologist at the University of Washington’s School of Medicine, has written that@IHME_UW’s overly optimistic modeling projections contributed to this debacle” of the coronavirus’s rapid spread in the US, and condemned their “amazing shrinking error band that, preposterously, constricts to zero uncertainty in mid-June. That is not only bad science communication — it is bad science.”

    The IHME model has also brought the discipline under fire from other fields. Tyler Cowen, whose widely read blog Marginal Revolution has linked many of the papers demonstrating how poorly the IHME model works, argued “now really is the time to be asking tough questions about epidemiology, and yes, epidemiologists.”

    That’s not fair, many epidemiologists say — the model doesn’t use any of the standard tools of the discipline, and they hate it too.

    “THAT THE IHME MODEL KEEPS CHANGING IS EVIDENCE OF ITS LACK OF RELIABILITY AS A PREDICTIVE TOOL”

    “The IHME approach departs from classic epidemiological modeling,” epidemiological modelers at the University of Texas at Austin argued. “Rather than using systems of equations to project the person-to-person transmission of the virus, the [IHME] model postulates that COVID-19 deaths will rise exponentially and then decline in a pattern that roughly resembles a bell curve (i.e., normal distribution).” (Their paper puts forward their own attempt at modeling the disease with a curve-fitting approach, but one tweaked to use better data and to better represent uncertainty.)

    So it might not be fair to draw conclusions about the field as a whole from one model that mostly avoided using its standard tools.

    Moreover, the public should be aware that there are better models. The Imperial College model that the British government relied on to inform their country’s coronavirus strategy has held up reasonably well, with case numbers loosely tracking the model’s predictions for what would happen if social distancing were implemented (as it was shortly after the model was published). It, too, has been frequently revised in response to new data and has come under criticism for overconfidence, but the inaccuracies are smaller and less pervasive, and the initial numbers before any revisions weren’t that far off.

    Other models, employing more standard epidemiological approaches, perform even better — though usually in narrower domains, like trying to project just the peak of the outbreak, or just the rate of new cases.

    The IHME team says their model performed pretty well on key problems like predicting the peak in most states (it’ll be clear in coming weeks how true that is) and that they’re continuing to revise it to make it better. Meanwhile, as the debate over epidemiological models heats up, it’s fair to say that holding the shortcomings of the IHME model against epidemiology as a whole isn’t fair.

    We don’t have all the answers

    But that still leaves the question: Why did the IHME model become so popular?

    The flaws I’ve noted above were also features that made the model appealing when it was first launched. It was optimistic, projecting lower deaths than other models. It was clear and precise, with narrow confidence intervals. It projected hospitalizations, which few others were doing — though those projections turned out to be wrong because not enough was known to project hospitalizations well at that stage. In a time of uncertainty, the IHME model was compelling.

    But it turns out the uncertainty being reflected in a lot of other, better models is showing up for a reason — there really is still a lot unknown about the course this disease will take.

    As my colleague Matt Yglesias has written, “We need to value scientists and listen to experts, but part of listening means understanding that right now, what they’re saying is that they do not have all the answers.”

    Given the enormous uncertainty ahead, responsible scientists are avoiding giving dramatic topline numbers they’re unsure of, emphasizing the very wide confidence intervals on their estimates, and being careful not to publish results that the Trump administration or the public may interpret as definitive.

    But people keep searching for definitive answers (understandably so), and so any model that is presented more confidently will rise to prominence over models that are humbler and better reflect the confusion.

    The IHME model is one of several released by researchers at the University of Washington, but it has been far more widely cited and discussed than the others — despite being less accurate.

    Ultimately, the problem may not be that some models are inaccurate. It was predictable that some models would be inaccurate, with the situation as confusing as it is. There are dozens of models, and ideally we’d be doing something like aggregating them and weighting each according to how well it has performed so far in predicting the crisis.

    The current process is almost exactly the opposite of that. Most models are nearly ignored, while a few are cited by the White House and widely referred to in the press. The process that makes some models prominent is not a process that picks out the best of the best — and in fact, it may actively be picking out worse models, by emphasizing ones with notable numbers and statistics to cite, by leaning into the seductive “appearance of certainty” that researchers have warned about.

    In other words, the fact that many epidemiological models are performing badly isn’t great, but it could be part of a productive process of arriving at better models. But the media, policymakers, and the public need to be conscious of what kind of models we gravitate to and why. If we elevate the ones we like and quote numbers from them as if they’re definitive, then the models will certainly end up shedding more heat than light

    Above is from:  https://www.vox.com/future-perfect/2020/5/2/21241261/coronavirus-modeling-us-deaths-ihme-pandemic

    May 3: 61,499 COVID-19 cases in Illinois


    In response to the COVID-19 pandemic, Gov. JB Pritzker has ordered Illinois residents to stay at home. Executive Order No. 10 requires all residents to stay home, with exceptions for essential needs or business activities. Gatherings of 10 people or more are prohibited. The order extends through May 30, 2020.
    COVID-19 Statistics
    Positive (Confirmed)
    61,499
    Deaths
    2,618
    Total Tests Performed*
    319,313
    Total Cases
    (61,499 5-3-2020) (58,505  5-2-2020)  56,055 5-1-2020) (52,918  4-30-2020) (50,355  4-29-3030) (48,102 4-28-2020) (45,883  4-27-2020) (43,903  4-26-2020) ( 41,777  4-25-2020) (39,658  4-24-2020)  (36,934 4-23-2020)  (35,108 4-22-2020)(33,059  4-21-2020) (31,508  4-20-2020) (30,357 4-19-2020)  (29,160  4-18-2020)  (27,575  4-17-2020) (25,733  4-16-2020)  (24,593 4-15-2020)  (23,247 4-14-2020)  (22,025 4-13-2020)  (20,852 4-12-2020) (19,180 4-11-2020 ) (17,887 4-10-2020) (16,422 4-9-2020) (15,078 4-8-2020) (13,549 4-7-2020) (12,262 4-6-2020) (11,256 4-5-2020) (10,357 4/4/2020) (8,904-- 4/3/2020) (7,695-- 4/2/2020)   (6,980-- 4/1/2020) (5,994-- 3/31/2020)  (5,05--7 3/30/2020) (4,596-- 3/29/2020)


    Deaths

    (2,618 5-3-2020) (2,559 5-2-2020) (2,457 5-1-2020) (2,355  4-30-2020) (2,215  4-29-2020)  (2,125  4-28-2020) (1,983  4-27-2020) (1,933 4-26-2020 )(1,874  4-25-2020) 1,795  4-22-2020) (1,688  2-23-2020) (1,585 4-22-2020) (1,468  4-21-2020) (1,349 4-20-2020)(1,290 4-18-2020)  (1,259  4-18-2020) (1,134  4-17-2020) (1,072  4-16-2020) (948 4-15-2020)  (866 4-14-2020) (794 4-13-2020)  (720 4-12-2020) (677 4-11-2020)(596 4-10-2020) (528 4-9-2020) (462 4-8-2020) (380 4-7-2020)(307 4-6-2020) (274 4-5-2020) (243—4-4-2020) (210-- 4-3-2020) (157 4-2-2020)(141 4/1/2020) (99 3/31/2020) (73 3/30/2020)  (65 3/29/2020)
    Total Persons Tested*
    (319,313  5-3-2020) (299,892 5-2-2020)  (284,688  5-1-2020) (269,867 4-30-2020) (256,667  4-29-2020) (242,189  4-28-2020) (227,628  4-27-2020) (214,952 4-26-2020) (201,617 4-25-2020) (186,219  4-24-2020)(173,316 4-23-2020) (164,346 4-22-2020)  (154,997  4-21-2020) (148,358 4-20-2020) (143,318 4-19-2020)  (137,404  4-18-2020) (130,163  4-17-2020)  (122,589  4-16-2020)  (116,929 4-15-2020) (110,616 4-14-2020)  (105,768 4-13-2020) (100,735 4-12-2020) (92,779 4-11-2020) (87,527 4-10-2020) (86,857 4-9-2020) (75,066 4-8-2020) (68,732 4-7-2020) (62,942 4-6-2020) (58,983 4-5-2020) (53,581—4-4-2020)  (48,048-- 4-3-2020) (43,653-- 4/2/2020) (40,384-- 4/1/2020) (35,225-- 3-31-2020) (30,446-- 3/30/2020)  (27,762-- 3/29/2020)

    *Total number of people reported electronically for testing of COVID-19 at IDPH, commercial or hospital laboratories. Deaths are included in the number of positive cases
    All numbers displayed are provisional and subject to change.

    Information to be updated daily.

    Above is from: http://www.dph.illinois.gov/covid19/covid19-statistics

    *****************************************************************************************************************************

    Home


    PROJECTIONS from:  http://www.healthdata.org/research-article/forecasting-covid-19-impact-hospital-bed-days-icu-days-ventilator-days-and-deaths Now being updated three times per week.

    Major Increase in Projected Deaths

    Total COVID-19 deaths projected through August 4, 2020 in Illinois (2,337  4-29-2020)   (2,316 4-27-2020)  (2093 4-21-2020) (2,259 4-15-2020) (1248 4-13-2020)

    (777 4-10-2020)  (1,584  4-8-2020) (3,629 4-5-2020)(3,386 4-2-2020) (2,789 4-1-2020)  (2,326  3-31-2020)  (2,369 as of 3/30/2020)  (2,454 AS OF 3-26-2020)

    COVID-19 deaths   Peak deaths  (95 deaths on 4-19-2020)               Previously (91 deaths on 4-12-2020)  (208 on 4-12-2020) (109 on 4-20-2020)

    Illinois Population:  12.74 million        Projected deaths per million: 181.79

    For a lengthier discussion of the projection model go to:  http://boonecountywatchdog.blogspot.com/2020/03/forecasting-covid-19-impact-on-hospital.html

    BOONE COUNTY

    *

    BOONE COUNTY (WREX) — A Belvidere nursing home makes up more than two-thirds of new COVID-19 cases in Boone County after health officials post Friday's coronavirus data.

    Symphony Northwoods, 2250 Pearl St., reported 17 new COVID-19 cases Friday and its seventh death.

    Boone County reported 25 new cases Friday, according to the Boone County Health Department. In total, the county has 125 cases and 11 deaths.

    Symphony Northwoods has 41 total cases reported.

    Above is from: https://wrex.com/2020/05/01/belvidere-nursing-home-reports-7th-covid-19-death/

    **************************************************************************************************************************************************************

    This page summarizes the latest data for COVID-19 in McHenry County. This data is provisional and subject to change.

    McHenry County

    McHenry County Cases


    McHenry County Cases


    703

    Source: McHenry County Department of Health

    McHenry County Deaths


    39

    Source: McHenry County Department of Health

    Illinois Cases


    58,505

    Source: IDPH as o 5/2/2020 5:00 PM

    Illinois Deaths

    Alden Terrace of McHenry

    Outbreak Reported Cases: 120

    Deaths: 4

    Cross Roads Care Center

    Outbreak Reported Cases: 41

    Deaths: 4

    Fair Oaks Health Care Center

    Outbreak Reported Cases: 13

    Deaths: 0

    Florence Nursing Home

    Outbreak Reported Cases: 18

    Deaths: 0

    Revere Court of Crystal Lake

    Outbreak Reported Cases: 11

    Deaths: 2

    The Fountains at Crystal Lake

    Outbreak Reported Cases: 67

    Deaths: 6

    The Springs at Crystal Lake

    Outbreak Reported Cases: 36

    Deaths: 3

    Three Oaks Assisted Living and Memory Care

    Outbreak Reported Cases: 7

    Deaths: 0


    Above is from:  https://mchenry-county-coronavirus-response-mchenrycountygis.hub.arcgis.com/

    *************************************************************************************************************************************************************************

    WINNEBAGO COUNTY, Ill. (WIFR) -- 61 new positive cases of COVID-19 are confirmed over the last 24 hours bringing the total to 562 cases. 2 new deaths are also confirmed, bringing the total to 21.

    Areas of concern are the following:

    -- Alden Alma Nelson Manor
    -- Amberwood Care Centre
    -- Anam Care
    -- East Bank Center
    -- Forest City Rehab & Nursing
    -- Goldie B Floberg Center
    -- Milestone
    -- Peterson Meadows
    -- River Bluff Nursing Home
    -- Rockford Rescue Mission
    -- Van Matre
    -- Winnebago County Jail

    Here is the breakdown of cases in the county by age group:

    -- 19 cases: 0-9 age group
    -- 34 cases: 10-19 age group
    -- 112 cases: 20-29 age group
    -- 107 cases: 30-39 age group
    -- 89 cases: 40-49 age group
    -- 92 cases: 50-59 age group
    -- 59 cases: 60-69 age group
    -- 27 cases: 70-79 age group
    -- 23 cases: 80 and older age group

    Here is the breakdown of the cases in the county by race ethnicity:

    -- 23%: White. Not Hispanic or Latino
    -- 20%: Black/African American, Not Hispanic or Latino
    -- 14%: Hispanic or Latino
    -- 3%: Asian, Not Hispanic
    -- 40%: Unknown


    **********************************************************************************************************************************************

    Cases in U.S.

    Updated  May 3, 2020
    U.S. At A Glance

    As of May 2, 2020

    Total Cases*

    1,092,815

    Total Deaths

    64,283   This page will be updated daily. Numbers close out at 4 p.m. the day before reporting.

    ***On Saturday and Sunday, the numbers in COVID-19: U.S. at a Glance and the figure describing the cumulative total number of COVID-19 cases in the United States will be updated. These numbers are preliminary and have not been confirmed by state and territorial health departments. CDC will update weekend numbers the following Monday to reflect health department updates.***

    CDC is responding to an outbreak of respiratory illness caused by a novel (new) coronavirus. The outbreak first started in Wuhan, China, but cases have been identified in a growing number of other locations internationally, including the United States. In addition to CDC, many public health laboratories are now testing for the virus that causes COVID-19.

    COVID-19: U.S. at a Glance*†

    • Total cases (1,092,815 5-2-2020)   (1,062,446  5-1-2020)(1,031,659  4-30-2020)  (1,005,147  4-28-2020) (957,875  4-27-2020) (928,619  4-26-2020)  (895,766  4-25-2020)   (865,585 4-24-2020)   (829,441   4-23-2020) (802,583  4-22-2020) (776,093 4-21-2020) (746,625 4-20-2020) (720,630 4-19-2020)  (661,712 4-17-2020)  (632,548 4-16-2020)  (605,390 4-15-2020) (579,005 4-14-2020)  (554,849 4-13-2020) (525,704 4-12-2020)  (492,416 4-11-2020)(459,165 4-10-2020) (427,460 4-9-2020) (395,011 4-8-2020)(374,329 4-7-2020) (330,891 4-6-2020) (304,826 4-5-2020) (277,205 4-4-2020) (239,279 4-3-2020) (213,144 4/2/2020)(186,101 4/1/2020) (163,539 3/31/2020) (140,904 3/30/2020)   (122,653  3-29-2020)
    • Total deaths  (64,283  5-2-2020)  (62,405 5-1-2020)  (60,057  4-30-2020) (57,505  4-28-2020)  (53,922 4-27-2020) (52,459  4-26-2020)  (50,439 4-25-2020) (48,816  4-24-2020) (46,379 4-23-2020) (44,575 4-22-2020)  (41,759 4-21-2020) (39,083 4-20-2020)  (37,202 4-19-2020)  (33,049 4-17-2020)  (31,071 4-16-2020) (24,582 4-15-2020) (22,252 4-14-2020) (21,942 4-13-2020)  (20,486 4-12-2020)  (18,559 4-11-2020) (16,570 4-10-2020) (14,696 4-9-2020) (12,754 4-8-2020) (12,064 4-7-2020) (8,910 4-6-2020)(7,616 4-5-2020)  (6, 593 4-4-2020) (5,443 4-3-2020) (4,513 4-2-2020) (3,603 4-1-2020) (2,860 3/31/2020) (2,405 3/30/2020)   (2,112  3-29-2020)
    • Jurisdictions reporting cases: 55 (50 states, District of Columbia, Puerto Rico, Guam, Northern Marianas, and US Virgin Islands)

    * Data include both confirmed and presumptive positive cases of COVID-19 reported to CDC or tested at CDC since January 21, 2020, with the exception of testing results for persons repatriated to the United States from Wuhan, China and Japan. State and local public health departments are now testing and publicly reporting their cases. In the event of a discrepancy between CDC cases and cases reported by state and local public health officials, data reported by states should be considered the most up to date.

    † Numbers updated Saturday and Sunday are not confirmed by state and territorial health departments. These numbers will be modified when numbers are updated on Monday.(

    Cases of COVID-19 Reported in the US, by Source of Exposure*†

    * Data include both confirmed and presumptive positive cases of COVID-19 reported to CDC or tested at CDC since January 21, 2020, with the exception of testing results for persons repatriated to the United States from Wuhan, China and Japan. State and local public health departments are now testing and publicly reporting their cases. In the event of a discrepancy between CDC cases and cases reported by state and local public health officials, data reported by states should be considered the most up to date.

    † CDC is no longer reporting the number of persons under investigation (PUIs) that have been tested, as well as PUIs that have tested negative. Now that states are testing and reporting their own results, CDC’s numbers are not representative of all testing being done nationwide.

    Above is from:  https://www.cdc.gov/coronavirus/2019-ncov/cases-updates/cases-in-us.html

    ***************************************************************************************************************************************

    Now being updated three times per week.

    PROJECTIONS:   US COVID-19 Deaths thru 8-4-2020) (72,433   4-29-2020)  (74,073 4-27-2020) (65,976 4-21-2020)  (60,308 4-15-2020) (68,841 4-13-2020)  (61,543 4-10-2020) (60,415 4-8-2020) (81,766 4-5-2020) (93,531 4/3/2020) (93,765 4/1/2020)   (83.967 3/31/2020)    ( 82,141 3/30/2020);  Peak Daily    (2150 4-13-2020)

    Older Peak Daily Deaths (2,212 on 4-12-2010)  (1,983 on 4-11-2020)  (2,644 on 4-16-2020)(3,130 on 4-16-2020) ( 2214 on 3/31/2020) (2,214 on 3/31/2 020) (2,271 3/30/2020)

    US Population:  331 million    Projected deaths per million: 223.79

    FROM:  http://www.healthdata.org/research-article/forecasting-covid-19-impact-hospital-bed-days-icu-days-ventilator-days-and-deaths Now being updated three times per week

    *********************************************************************************************************************************************

    COVID-19 Tracker   Great site to find specific county, state, country numbers is at:  https://bing.com/covid?form=msntrk  Site supplies case numbers, recovered cases and deaths by country and US state.

    World population: 7.8  BILLION

    3,494,671

    Active cases

    2,133,298

    +50,742

    Recovered cases

    1,114,898

    +46,050

    Fatal cases

    246,475

    +4,928