Monday, August 31, 2020

30 counties now at warning level for COVID-19 resurgence

30 counties now at warning level for COVID-19 resurgence

30 counties now at warning level for COVID-19 resurgence

Thirty counties in Illinois are now at the warning level for a resurgence of COVID-19 infections. (Credit: Illinois Department of Public Health)

Friday, August 28, 2020

IDPH reports 2,149 new cases, 20 additional deaths

By PETER HANCOCK
Capitol News Illinois
phancock@capitolnewsillinois.com

SPRINGFIELD – Thirty counties in Illinois are now at the warning level for a resurgence of COVID-19 infections, the Illinois Department of Public Health announced Friday, more than double the number listed at that level two weeks ago.

IDPH issues a warning when a county crosses certain targets for two or more risk indicators that measure the amount of COVID-19 increase. Those include things such as the daily number of new cases per 100,000 population, the county’s test positivity rate and new hospital admissions for COVID-19.

As of Friday, the counties now on the warning list include Bureau, Carroll, Cass, Clinton, Cook,  Cumberland, Effingham, Fayette, Greene, Grundy, Henderson, Henry, Jasper, Jersey, Jo Daviess, Johnson, Madison, Monroe, Morgan, Perry, Pike, Randolph, Sangamon, Shelby, St. Clair, Union, Warren, White, Will and Williamson.

IDPH released that list the same day it announced 2,149 new cases of the disease over the previous 24 hours and 20 additional virus-related deaths. That brings the statewide totals since the pandemic began in Illinois to 229,483 cases, and 7,997 deaths.

Laboratories in Illinois reported processing 48,383 tests during the 24-hour period, making for a single-day positivity rate of 4.4 percent. The statewide rolling seven-day average positivity rate for Aug. 21-27 stood at 4.1 percent.

As of Thursday night, 1,546 people in Illinois were reported hospitalized with COVID-19.  Of those, 352 patients were in the ICU and 132 patients with COVID-19 were on ventilators. Those were all decreases from the numbers reported Thursday.

Capitol News Illinois is a nonprofit, nonpartisan news service covering state government and distributed to more than 400 newspapers statewide. It is funded primarily by the Illinois Press Foundation and the Robert R. McCormick Foundation

Above is from:  https://www.capitolnewsillinois.com/NEWS/30-counties-now-at-warning-level-for-covid-19-resurgence

States not the President controls the National Guard


AP FACT CHECK: Trump tweets distort truth on National Guard

By CALVIN WOODWARD and SCOTT BAUER31 minutes ago

1 of 4

Volunteers paint murals on boarded-up businesses in Kenosha, Wis., on Sunday, Aug. 30, 2020, at an "Uptown Revival." The event was meant to gather donations for Kenosha residents and help businesses hurt by violent protests that sparked fires across the city following the police shooting of Jacob Blake. (AP Photo/ Russell Contreras)

WASHINGTON (AP) — It’s become a pattern when unrest flares in a city: President Donald Trump suggests he has National Guard troops ready to send to the scene and takes credit for dispatching them and restoring calm while he accuses Democrats of being squishy on law and order.

That’s a distortion.

Trump omits the fact that he is largely a bystander in National Guard deployments. While presidents can tap rarely used powers to use federal officers for local law enforcement, there is no National Guard with national reach for Trump to send around the country.

And when violence broke out in Kenosha, Wisconsin, a week ago, Trump’s demand that National Guard troops be used came a day after the Democratic governor had already activated them.


National Guard units in each state answer to the governor and sometimes state legislatures, not to the president. When National Guard forces from outside Wisconsin came in to help, it was because the governor has asked for that help from fellow governors, not the White House.

You would know none of this from Trump’s Twitter account and much of his other rhetoric in recent weeks as he has assailed Democratic officials in Minnesota, Oregon and Wisconsin for not doing enough quickly enough to stem violence..

Here’s how Trump’s words played against reality after a Kenosha, Wisconsin, police officer shot Jacob Blake, sparking protests and yet more violence over police actions and racism:

TRUMP, TUESDAY, AUG. 25: “Governor should call in the National Guard in Wisconsin. It is ready, willing, and more than able. End problem FAST! ”

THE FACTS: Although Trump was within his right to urge use of the National Guard, he did not seem up to speed on the fact it had already happened.

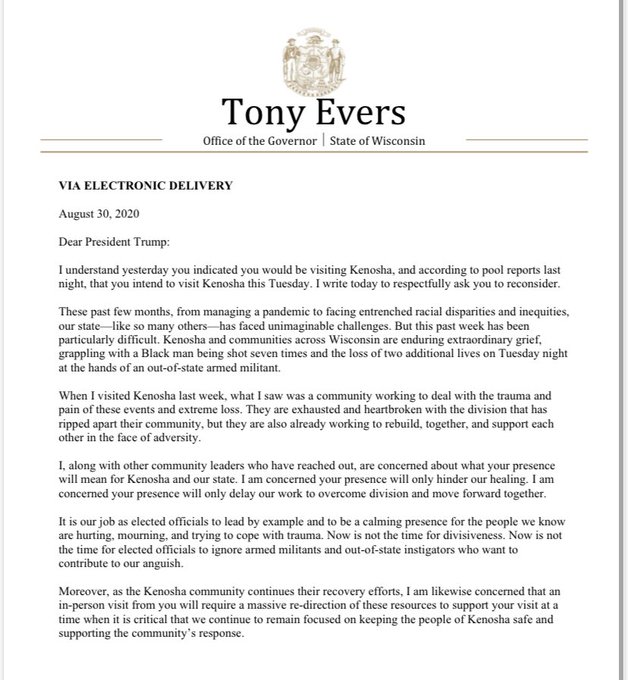
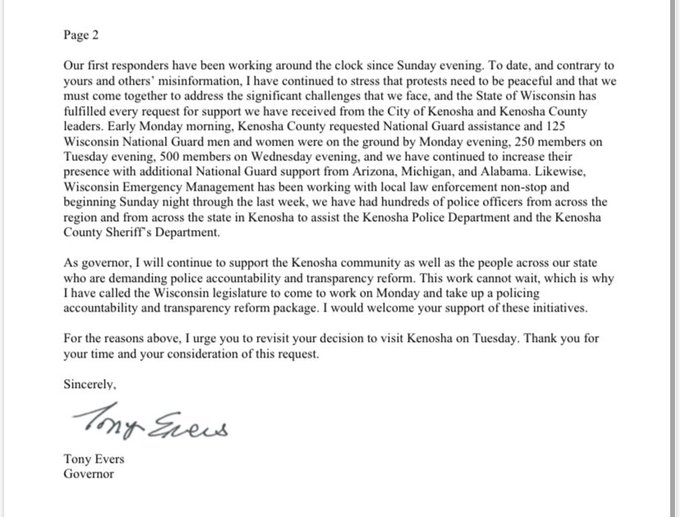
On Monday, Aug. 24 -- the day after Blake’s shooting — Gov. Tony Evers issued a statement saying that at the request of local officials, he had “authorized the Wisconsin National Guard to support local law enforcement in Kenosha County to help protect critical infrastructure and assist in maintaining public safety and the ability of individuals to peacefully protest.”

On that Monday night, when police say a 17-year-old armed civilian shot and killed two protesters, Wisconsin National Guard troops were on the ground.

___

TRUMP, WEDNESDAY, AUG. 26: “TODAY, I will be sending federal law enforcement and the National Guard to Kenosha, WI to restore LAW and ORDER!”

THE FACTS: The statement that he was sending the National Guard is false.

ADVERTISEMENT

The statement that he would send federal law enforcement is true. The federal government sent deputy marshals from the U.S. Marshals Service and agents from the FBI and the Bureau of Alcohol, Tobacco, Firearms and Explosives, about 200 in all.

Meantime the governor declared a state of emergency and kept increasing the numbers of deployed Wisconsin National Guard troops while saying he was working with other states to get “additional National Guard and state patrol support.”

The next day, Thursday, Evers announced that National Guard troops from Arizona, Michigan and Alabama were coming and would operate under the control of those states and Wisconsin, “not in a federal status.”

___

TRUMP, FRIDAY, AUG. 28: “Success: Since the National Guard moved into Kenosha, Wisconsin, two days ago, there has been NO FURTHER VIOLENCE, not even a small problem. When legally asked to help by local authorities, the Federal Government will act and quickly succeed. Are you listening Portland?”

THE FACTS: This statement falsely insinuates that the federal government sent the National Guard and took care of the problem. He also implies that Portland, Oregon, was dragging its feet in having federal authorities do the same there.

In Wisconsin, officials said the ranks of the Guard had swollen to 1,000 in Kenosha and more were coming from the three states tapped to help.

___

TRUMP, SATURDAY, AUG. 29: “Kenosha has been very quiet for the third night in a row or, since the National Guard has shown up. That’s the way it works, it’s all very simple. Portland, with a very ungifted mayor, should request help from the Federal Government. If lives are endangered, we’re going in! ”

THE FACTS: Another boast based on the falsehood that Trump sent in the Guard to Kenosha.

That night, in Portland, a skirmish broke out between Trump supporters and counterprotesters, and afterward a right-wing Trump supporter was fatally shot.

___

TRUMP, AUG. 30, referring to Portland: “The National Guard is Ready, Willing and Able. All the Governor has to do is call!”

THE FACTS: No, calling the White House is not what governors do when they want National Guard help. They call other governors. In earlier protests in Portland, Seattle and Washington, D.C., Trump sent security teams from federal agencies over the objections of local leaders.

___

TRUMP, MONDAY: “If I didn’t INSIST on having the National Guard activate and go into Kenosha, Wisconsin, there would be no Kenosha right now. Also, there would have been great death and injury. I want to thank Law Enforcement and the National Guard.”

THE FACTS: He insisted on action that the governor had already taken and claims a success he did not earn. ___

Bauer reported from Madison, Wisconsin. Associated Press writers Robert Burns and Michael Balsamo contributed to this report.

___

EDITOR’S NOTE — A look at the veracity of claims by political figures.

___

Find AP Fact Checks at http://apnews.com/APFactCheck

Follow @APFactCheck on Twitter: https://twitter.com/APFactCheck

Above is from:  https://apnews.com/2ea05933a91212ccfb1a3ae4c39e0e79

Democratic nominee plans meet-and-greets at 35 parks


Image


Brzozowski addresses nuclear energy, jobs, Kinzinger at La Salle, Ottawa events

Democratic nominee plans meet-and-greets at 35 parks

By Kevin ChlumEmailFollow

Aug. 29, 2020


Congressional candidate Dani Brzozowski (right) talks with a voter at a campaign event Saturday at Hegeler Park in La Salle.

Kevin Chlum

Caption

Congressional candidate Dani Brzozowski (left) talks with voters at a campaign event Saturday at Hegeler Park in La Salle.

Kevin Chlum

Caption


Kevin Chlum

Caption


Kevin Chlum

Caption

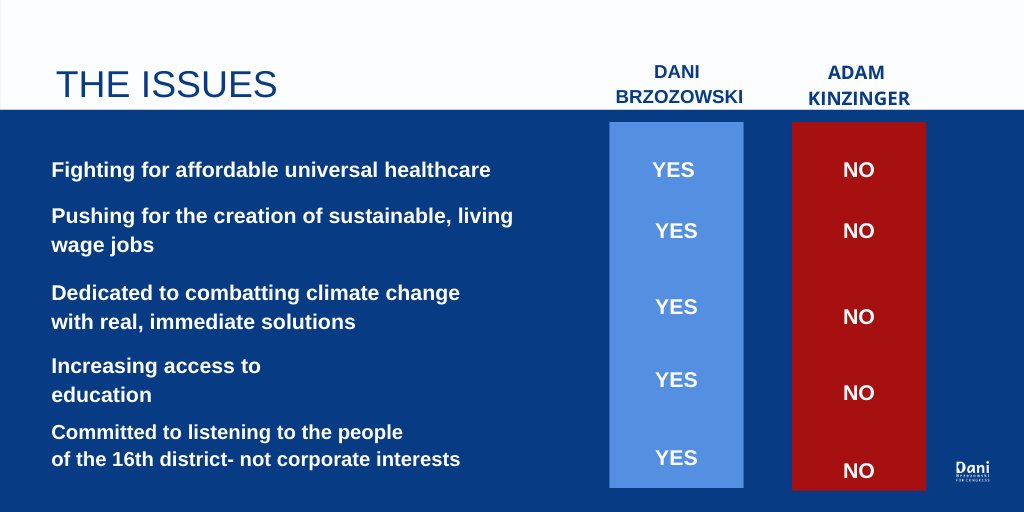
Over the next five weeks, Dani Brzozowski is holding meet-and-greets at 35 parks throughout Illinois District 16.

The Democratic nominee, who is challenging incumbent Adam Kinzinger, made two of those stops Saturday in La Salle County with visits to Washington Square Park in Ottawa and Hegeler Park in La Salle.

Answering questions from constituents, she addressed the closing of two nuclear power plants, nuclear energy, corporate welfare, campaign donations, social security and keeping jobs and production in the United States.

At her park visits, people have also wanted to discus COVID-19, the Republican National Convention and the economy, including job creation.

Closure of nuclear power plants in Byron, Dresden

Brzozowski said she’s “aggressively pro-nuclear” because it's clean energy. She’s worried about the loss of 1,500 full-time jobs and 2,000 regular temporary jobs at the two facilities and other negative affects of their closure, including increases in property taxes and utility bills and a decrease in services.

“What we need is sweeping policy at the federal level that supports nuclear energy,” Brzozowski said. “Nuclear energy is exempt from some pieces of legislation that props that industry up. We need to make sure we classify nuclear energy as clean energy and provide it the resources it needs, not just to be protected in the way it is now, but to expand. That’s job creation, and it’s movement toward a fossil-free fuel economy that we need.”

Corporate welfare

When asked if the nuclear closures by Exelon were a play for corporate welfare, Brzozowski said she believed Exelon’s statement was that it was hurting due to poor policy and falling energy prices.

She said the state and federal government need to do to more to support nuclear energy.

“The question about corporate welfare points to something else that has to be discussed, and that’s the way our economy supports the interests of corporations at the expense of working families,” Brzozowski said. “That’s something that needs to be addressed with really serious modifications to our tax structure. We have to hold corporations accountable for their emissions.

"Corporate carbon taxation is something that’s overwhelmingly supported by people all over the place.”

Campaign donations

Brzozowski was asked how much Kinzinger has taken from Exelon, and she said $55,000 over 10 years running for Congress and noted 95% of his campaign dollars come from corporate PACs and ultra wealthy conservative donors.

“I'm committed to taking $0 of corporate PAC money, and we’ve taken exactly that. Our average donation is under $100,” Brzozowski said. “We’re funded by people who recognize what we’re fighting for in this district is sincere representation that comes from this community. This place is my home, so it’s natural for me to want to fight for the people who live here.

“Adam Kinzinger voted against capping prescription drug costs. Something like 90% of Americans are scared of rising costs of prescription drugs. When a bill comes up to cap prescription drug costs, you’d think there’d be overwhelming support, but Adam Kinzinger voted against it. When you see he has taken tens of thousands of dollars from big pharma, it becomes clear that Adam Kinzinger does not answer to the people of this district. He answers to his big corporate donors.”

Social security

Brzozowski said she is concerned about the Republican party’s “aggressive attempts to dissemble the social safety net.”

“There’s an easy way to address social security and the lack of funding for it,” Brzozowski said. “For social security, there is a cap. People who make more than $137,000 don’t pay into social security at the same rate the rest of us do. If we remove the cap, those people pay more, and then social security is funded for decades. There are a lot of legislative things that are super complex and feel really difficult. This is not one of them.

"There’s an easy answer here. Remove the cap.”

Keeping jobs in America

Brzozowski said there needs to be incentives for corporations to keep jobs in the United States.

“Corporations have proven they’re not going to do it on their own accord,” Brzozowski said. “There will be places where there’s cheaper labor. There will be places you can offshore money. There are too many loopholes in the existing system to permit the kind of growth and incentives that need to happen to provide jobs and living wages for people in the United States of America.”

Above is from:  https://www.bcrnews.com/2020/08/29/brzozowski-addresses-nuclear-energy-jobs-kinzinger-at-la-salle-ottawa-events/am3tk91/

Has Trump hurt China?


Trump's Tariffs? Coronavirus? China's Exports Are Surging Anyway

Keith Bradsher

,

The New York TimesAugust 31, 2020

A worker prepares wood to assemble saunas at Hongyuan Furniture in Guangzhou, China, Aug. 4, 2020. (Andrea Verdelli/The New York Times)

A worker prepares wood to assemble saunas at Hongyuan Furniture in Guangzhou, China, Aug. 4, 2020. (Andrea Verdelli/The New York Times)

ZHONGSHAN, China — This was supposed to be the year that China’s export machine began to stall. President Donald Trump had imposed broad tariffs on Chinese goods. Countries like Japan and France pushed companies to shift production from China. The pandemic had crippled China’s factories by the end of January.

Instead, China Inc. has come roaring back.

After reopening in late February and early March, China’s factories began an export blitz that is still gaining steam. Exports soared in July to their second-highest level ever, nearly matching the record-setting Christmas rush last December. The country has grabbed a much larger share of global markets this summer from other manufacturing nations, entrenching a dominance in trade that could last long after the world begins to recover from the pandemic.

China is showing its export machine cannot be stopped — not by the coronavirus and not by the Trump administration. Its resilience lies not only in the country’s low-cost, skilled labor and efficient infrastructure but also in a state-controlled banking system that has been offering small and large businesses extra loans to cope with the pandemic.

The pandemic has also found China better placed than other exporting nations. It is making what the world’s hospitals and housebound families need right now: personal protection gear, home improvement products and lots of consumer electronics.

At the same time, demand has withered for many big-ticket items exported by the United States and Europe, like Boeing and Airbus jets. And with most economies except China’s now mired in recessions, demand has also faltered for the commodities that most developing countries export, particularly oil.

Families all over the world are sprucing up the homes they are now stuck inside. They have been buying everything from computer screens and stereo systems to power tools and home saunas — many of which are made in China.

Hongyuan Furniture in the southern city of Guangzhou has hired 50 extra workers after export orders for its home saunas more than doubled this year. A short drive farther south in Zhongshan, Star Rapid has stayed profitable, making robot casings and quickly producing high-tech models — a process known as rapid prototyping. And a few miles to the west, Trueanalog has ruled out moving production of its top-end stereo speakers to the United States, its main market, or to Vietnam, where wages can be even lower.

At Trueanalog, rows of workers at long, green tables under fluorescent lights meticulously assemble audio speakers for professional recording studios in the United States. China dominates the world’s production of the components that go into the speakers they are putting together — whether magnets, paper cones or rubber foam.

“China has the largest supply chain of the parts you need to make a speaker, and China has the most stable, affordable labor force,” said Philip Richardson, the American owner of Trueanalog.

Star Rapid, the prototype maker, has benefited from Chinese loans. Within days of the start of the pandemic, the state-controlled Bank of China called Gordon Styles, the company’s British chief executive and owner, and strongly urged him to take a $1.4 million corporate loan at low interest, which he did even though the company was still profitable. Chinese authorities also granted the company a rapid-fire series of partial rebates on taxes and government-mandated benefit costs that together exceeded 3% of the company’s sales.

“They wanted to make sure the good companies, as they measure that, don’t fail for lack of a bit of cash,” he said.

The strength of China’s export machine complicates the Trump administration’s push to reduce the trade deficit — the gap between what the United States exports and what it imports. Trump points to the deficit as proof that unfair practices by China have been hurting the United States, and he has campaigned on promises to get tough on China.

In January, China promised big increases in its imports from the United States as part of an agreement aimed at ending a protracted and increasingly bruising economic war. But actual purchases have lagged.

The agreement left in place most of Trump’s new tariffs, mainly at 25%. Yet those tariffs do not seem to deter many Americans from buying Chinese products, in part because the tariffs are only collected on the wholesale value of products when they reach America’s shores.

Hongyuan says it has not yet encountered any new competition from home sauna manufacturers based elsewhere despite facing 25% American tariffs for the past two years. Hongyuan also has access to dozens of suppliers within an hour’s drive that compete vigorously to produce inexpensive glass doors and hinges at the lowest cost.

So Hongyuan can afford to import lumber across the Pacific from Canada, saw the wood and polish it and assemble it into home saunas, and then ship the saunas in kits back across the Pacific all for less than it costs to make saunas in the United States. Considerable hand labor is still involved, although Chinese-made automatic saws now take the lumber in one end and put out boards of various shapes and dimensions.

“Even with the 25% tariff, the manufacturers in China still have lower costs,” said Rachel Wang, the company’s export manager.

Such a cost advantage has helped drive China’s share of world exports to nearly 20% in the April to June quarter this year, up from 12.8% in 2018 and 13.1% last year, said Rajiv Biswas, chief Asia economist at IHS Markit, a global data and consulting firm.

Part of that increase is temporary. Some factories elsewhere closed temporarily during the spring because of coronavirus lockdowns or supply chain disruptions linked to the pandemic. China’s own share of global exports dipped somewhat in the January to March quarter, to 11%, as it was battling the virus.

But China now appears strong in exports across many sectors, even as the cost of its imports is likely to stay low for months to come. China’s trade surplus — when the value of its exports exceeds that of its imports — has ballooned this summer, especially in July.

China’s exports have been helped by the country’s currency, which has remained mysteriously weak even as the economy has emerged from the pandemic with growth stronger than in practically any other nation.

China’s currency, the yuan, also known as the renminbi, has strengthened only slightly against the dollar in recent months. It has also weakened 6% against the euro since the start of May, even though Europe faces a severe recession.

Foreign economists suspect the Chinese government has used its tight control of the country’s financial system to keep the yuan weak. Brad Setser, an economist at the Council on Foreign Relations in New York, said the most likely explanation for the currency’s performance this summer was that state-owned or state-controlled Chinese banks and other financial institutions were shifting some of their immense assets, selling vast sums of yuan and buying dollars or euros to prop up those currencies.

The People’s Bank of China has said, including in a statement last week, that it is not manipulating the yuan but has also said it is committed to maintaining a mostly stable value for the currency.

China’s advantages go beyond a weak currency, however. China has built a 700-city bullet train network in a decade. It also has an abundance of labor, a culture of long working hours and tightly restricted unions. Manufacturers are not as encumbered by environmental laws against pollution as in many other countries.

Robert Gwynne, a shoe manufacturing and exports specialist in Guangdong, said reviving competitiveness in the United States and elsewhere to compete with China would not be quick or easy.

“To get it back,” he said, “you’re looking at 20 to 30 years, depending on what business you’re in.”

To be sure, China’s dominance of global manufacturing could be hurt by geopolitical shifts, such as if other countries demand that companies move part of their supply chains elsewhere. The United States and Japan have begun to do so. European governments like France’s have started to move in the same direction, particularly for medical supplies. Large companies with the capacity to set up entirely new supply chains elsewhere, like Foxconn of Taiwan and Apple, are exploring alternatives.

But the pandemic, which has grounded many flights and slowed logistics, has shielded China at least temporarily from attempts to move factories to other countries. Many multinationals have cut back on investment as global demand has slowed and so have little money to set up new operations elsewhere.

“In the middle of a global recession, companies are not going to divest unless trade barriers force them,” said Joerg Wuttke, president of the European Chamber of Commerce in China. “Companies would rather close facilities than open up new ones.”

This article originally appeared in The New York Times.

Above is fromhttps://news.yahoo.com/trumps-tariffs-coronavirus-chinas-exports-190336534.html

August 31: 1668 New COVID-19 cases in Illinois


Coronavirus positivity rate in St. Louis region remains above limit as Illinois reports 1,668 new cases, 7 deaths

CORONAVIRUS

by: Mike Ewing

Posted: Aug 31, 2020 / 12:49 PM CDT / Updated: Aug 31, 2020 / 12:49 PM CDT

<?XML:NAMESPACE PREFIX = "[default] http://www.w3.org/2000/svg" NS = "http://www.w3.org/2000/svg" />

CHICAGO — Illinois counties outside St. Louis could face stricter mitigation measures as early as tomorrow as the COVID-19 test positivity rate in the region remains above state limits nearly two weeks after additional restrictions were put in place, data released Monday shows.

Additional state-imposed restrictions remain in effect in both the South Suburban region, which includes Will and Kanakakee counties, and the Metro East region outside St. Louis after their 7-day positivity rates passed an 8 percent limit set by the state for more than three consecutive days.

The rates in both regions remain above 8 percent as of August 28, with a 10.4 percent positivity rate in Metro East and an 8.8 percent positivity rate in South Suburban region.

Even stricter mitigation measures could be announced in Metro East as early as tomorrow, as health officials previously said they would be put in place if the region failed to drop below an 8 percent average positivity rate after 14 days.

Illinois health officials reported 1,668 new cases of COVID-19 and seven coronavirus-related deaths have been confirmed over the past day Monday.

According to the Illinois Department of Public Health, a total of 235,023 cases of coronavirus disease and 8,206 related deaths have been confirmed since the pandemic began. The seven deaths reported Monday is below the current 7-day average, which is about 20 deaths per day, after rising from a low of about 16 per day in late July.

The statewide positivity rate from August 24-30 came in at 4.1 percent, near the 4 percent level where it has been since late July.

The 7-day testing average has been rising since late July as well, and the 47,379 new tests reported over the past 24 hours is near the 7-day average of about 46,000. To date, health officials estimate 95 percent of confirmed COVID-19 cases have recovered.

“There hasn’t been a vaccine approved in less than 4 years, ever in history” A doctor answers your COVID-19 questions

Indiana health officials reported 897 new cases of COVID-19 and five coroanvirus-related deaths were reported over the past day Monday, while the 7-day positivity rate from August 17-24 came in at 6.9 percent.

Above is from:  https://wgntv.com/news/coronavirus/coronavirus-positivity-rate-in-st-louis-region-remains-above-limit-as-illinois-reports-1668-new-cases-7-deaths/

******************************************************************************************************************************************************************

August 31: Johns Hopkins COVID-19 Report

COVID-19

Updates on the emerging novel coronavirus pandemic from the Johns Hopkins Center for Health Security.

The Center for Health Security is analyzing and providing updates on the COVID-19 pandemic. If you would like to receive these updates, please subscribe below and select COVID-19. Additional resources are also available on our website.

Subscribe to our newsletter

The Johns Hopkins Center for Health Security also produces US Travel Industry and Retail Supply Chain Updates that provide a summary of major issues and events impacting the US travel industry and retail supply chain. You can access them here.

EPI UPDATE The WHO COVID-19 Dashboard reports 25.12 million cases (264,107 new) and 844,312 deaths (5,385 new) as of 8:15am EDT on August 31.

Total Daily Incidence (change in average incidence; change in rank, if applicable)

1. India: 65,526 new cases per day (+8,031)

2. USA: 42,079 (-684)

3. Brazil: 36,647 (-1,294)

4. Colombia: 9,542 (-860)

5. Argentina: 9,205 (+2,390; ↑ 1)

6. Spain: 7,605* (+1,428; ↑ 1)

7. Peru: 7,549 (-791; ↓ 2)

8. Mexico: 5,097 (-554)

9. France: 5,006 (+1,526; new)

10. Russia: 4,797 (-45; ↓ 1)

Per Capita Daily Incidence (change in average incidence; change in rank, if applicable)

1. Maldives: 235 new daily cases per million population (-28)

2. Peru: 229 (-24)

3. Bahrain: 213 (-6)

4. Argentina: 204 (+53; ↑ 5)

5. Colombia: 188 (-16; ↓ 1)

6. Israel: 179 (+6)

7. Brazil: 172 (-7; ↓ 2)

8. Panama: 171 (+7; ↓ 1)

9. Costa Rica: 165 (+15; ↑ 1)

10. Spain: 163 (+21; new)

*Spain’s average daily incidence is not reported for today; these values correspond to the previous day’s averages. Spain’s average daily incidence has not changed since August 27.

India has surpassed the US for the global record for average daily incidence. At 73,557 new cases per day, India is already nearly 10% higher than the previous record, and case counts are still accelerating. The Philippines fell out of the top 10 in terms of total daily incidence, and it was replaced by France. The Bahamas fell out of the top 10 in terms of per capita daily incidence, and it was replaced by Spain. No countries are currently reporting more than 250 daily cases per million population.

UNITED STATES

The US CDC reported 5.93 million total cases (44,292 new) and 182,149 deaths (1,006 new). In total, 19 states (no change) are reporting more than 100,000 cases, including California, Florida, and Texas with more than 600,000 cases; New York with more than 400,000; and Arizona, Georgia, and Illinois with more than 200,000. We expect California to surpass 700,000 cases in its next update. The US continues to average fewer than 1,000 deaths per day; however, the daily total is decreasing very slowly. The US is currently averaging 928 deaths per day, still nearly double the national low of 484 deaths per day on July 6.

Several US territories continue to report extremely high per capita daily incidence. Guam is reporting 446 daily cases per million population, which would be #1 globally—nearly 90% greater than the Maldives, the actual #1. Guam’s daily incidence has held relatively steady since August 27. The US Virgin Islands is reporting 205 daily cases per million population, which would be #4, falling between Bahrain and Argentina. Puerto Rico would have fallen out of the top 10, but it is still reporting 147 daily cases per million population—more than 15% greater than the rest of the US.

The Johns Hopkins CSSE dashboard reported 6.01 million US cases and 183,258 deaths as of 1:30pm EDT on August 31.

PREVALENCE & TRANSMISSION IN CHILDREN New research published in JAMA Pediatrics describes the prevalence of asymptomatic SARS-CoV-2 infection in children. The study included pediatric patients who sought care at 25 US children’s hospitals who were tested for SARS-CoV-2 prior to receiving care for other conditions (e.g., surgery). Out of 33,041 children tested in April and May, 250 asymptomatic infections were detected. The prevalence at individuals facilities ranged from 0%-2.2%, and the overall prevalence was estimated to be 0.65%. Increases in asymptomatic pediatric infections within the hospitals was significantly associated with increases in incidence among the surrounding general population.

Two case studies published in the US CDC’s Morbidity and Mortality Weekly Report (MMWR) address SARS-CoV-2 transmission among children in non-school congregate settings. One article describes the reopening of 4 overnight summer camps in Maine (US). The camps had a total of 1,022 attendees from 41 states, and they were successful in preventing secondary transmission of SARS-CoV-2 in the camp setting. The camps implemented multiple preventative measures, including quarantine, symptom screening, testing, and enhanced hygiene measures. All campers and staff were instructed to quarantine for 10-14 days with their family prior to arriving at the camp, and the camp provided additional guidance for campers during travel to the site. All attendees either tested negative within 5-7 days prior to arriving at the camp or had documented SARS-CoV-2 infection in the previous 2 months. Four asymptomatic individuals tested positive during the pre-arrival testing, and they were required to complete isolation before joining the group. The attendees were placed in a “bubble” with a designated cohort of attendees, and cohorts remained separate from each other for 14 days after arrival. Testing was repeated 4-9 days after arrival, and 3 additional asymptomatic cases were identified and isolated. Symptom screenings were conducted for all campers and staff daily. No secondary transmission by symptomatic individuals was detected at any of the 4 camps, but the possibility of additional asymptomatic cases cannot be ruled out.

The second MMWR article describes the reopening of 666 childcare programs—approximately 18,945 children—in Rhode Island (US) in June and July. The Rhode Island Department of Human Services initially limited capacity at childcare centers to 12 total individuals initially and then later expanded to 20. The programs were also required to implement universal mask use for staff, daily symptom screenings for staff and children, and enhanced hygiene and cleaning practices. Compliance with regulations was enforced through unannounced visits by state officials. If anyone developed symptoms, the centers were required to close for 14 days, or until a negative test ruled out SARS-CoV-2 infection. Throughout the study period, 101 individuals were identified as a possible SARS-CoV-2 infections, of which 33 tested positive and 19 were symptomatic but not tested—30 children, 20 teachers, and 2 parents. In total, 29 childcare programs, and health officials were able to rule out secondary transmission in all but 4 programs.

IMMUNOLOGY Two recent studies provide further analysis of the immune response to SARS-CoV-2 infection. The first study, published in the US CDC’s Emerging Infectious Diseases, included 28 participants with severe COVID-19 disease and 15 participants who recently recovered from mild COVID-19. Participants with mild COVID-19 exhibited a delayed increase in IgG and neutralizing antibodies compared to patients with severe COVID-19; however, the IgM response reactive toward S1 and E proteins increased early for both groups. The researchers suggest that mild cases of COVID-19 may “not necessarily represent an intermediate stage between severe and asymptomatic COVID-19,” but further research is required to better characterize the human immune response and any associations with disease severity.

The second study, published in Nature, explored differences in viral load, antibody titers, and plasma cytokines in female and male COVID-19 patients. The study included 98 total participants treated at Yale-New Haven hospital in Connecticut (US). The researchers found that female patients exhibited a more robust T cell activation than male patients, whereas male patients had higher levels of innate immune response, including IL-8 and IL-18 cytokines. They also found that poor T cell response was “associated with worse disease outcomes in male patients, but not female patients” and that elevated innate cytokine response was associated with more severe disease in females but not males. These differences could potentially inform variations in treatment courses for female and male COVID-19 patients.

REINFECTION After researchers in Hong Kong published details of a COVID-19 patient who appears to have been infected twice, with different strains of the virus, a team of US researchers report evidence that a COVID-19 patient in Nevada was also reinfected. The patient, a 25-year-old male, tested positive for SARS-CoV-2 in late April and was discharged following 2 negative diagnostic tests. He then tested positive again approximately 1 month later. The researchers indicate (preprint) that, like the patient in Hong Kong, genetic analysis of the specimens from the Nevada patient indicated that he was infected with 2 different strains of SARS-CoV-2. This is the first documented instance of SARS-CoV-2 reinfection in the US. One notable difference between the Hong Kong patient and Nevada patient is the severity of their second infection. The Hong Kong patient was asymptomatic when he was identified via screening upon arrival in Hong Kong, whereas the Nevada patient experienced much more severe disease during his second infection. While it still appears that reinfection is relatively rare, researchers will inevitably identify more cases. With tens of millions of cases, many of whom recovered from their initial infection months ago, we will certainly hear about more reinfections in the coming months. As more examples of reinfection are identified, researchers will aim to answer critical questions, some of which could provide critical insight into the efficacy of future vaccines.

INFLUENZA VACCINE MANDATE Health experts continue to warn about the risks associated with simultaneous epidemics of COVID-19 and seasonal influenza, and governments are scaling up efforts to increase access and participation in seasonal influenza vaccination. While the US government has purchased an increased volume of seasonal influenza vaccine this year, state governments, many of which are already overburdened with the COVID-19 response, will be responsible for coordinating the distribution and administration of the vaccine to the public. Some states are also purchasing their own vaccine and initiating campaigns to educate the public and promote seasonal influenza vaccination. While many Southern Hemisphere countries reported much lower seasonal influenza incidence compared to previous years, many of those countries have had greater success in limiting SARS-CoV-2 transmission than the US, including through social distancing and mask use. It remains unclear whether COVID-19 measures will have any meaningful impact on the Northern Hemisphere influenza season or if simultaneous epidemics in some countries could compound the burden on health systems.

In Massachusetts (US), the Department of Public Health is requiring seasonal influenza vaccination for all children age 6 months and older in order to attend child care, preschool, K-12, and colleges and universities. Exemptions will be available for medical and religious reasons. Vaccination will not be required for college and university students participating in all-remote classes; however, K-12 students in school districts that are conducting classes remotely will not be exempt. The addition of the seasonal influenza vaccine to the Massachusetts vaccination schedule appears to be a permanent change, extending beyond the COVID-19 pandemic, but the health department’s Medical Director, Dr. Larry Madoff, emphasized that seasonal influenza vaccination is even more important during the COVID-19 response. In response to the announcement, hundreds of protesters gathered at the Massachusetts State House. The protesters included both anti-vaccine advocates and parents concerned about the state eliminating their ability to make choices for their children’s health.

RAPID TEST IN ASYMPTOMATIC INFECTIONS Following the announcement of an Emergency Use Authorization (EUA) for its new SARS-CoV-2 rapid antigen test, the CEO of Abbott Laboratories, Robert Ford, announced that the company is currently conducting a clinical trial to collect data on the test’s accuracy for asymptomatic infection. The EUA limits the test’s use to individuals within 7 days of developing COVID-19 symptoms, but it is generally understood that transmission by asymptomatic or presymptomatic individuals plays a major role in driving the pandemic. The ability to rapidly screen asymptomatic individuals for infection would further increase the test’s utility during the pandemic. The test does not require specialized or proprietary equipment or supplies beyond the test kit itself. The test is capable of providing results in approximately 15 minutes, much faster than traditional PCR-based diagnostic tests. The widespread availability of a rapid point-of-care diagnostic test that works on asymptomatic individuals could improve the ability to identify and isolate infectious individuals or screen larger groups of people for possible infection, which could facilitate efforts to resume some social and economic activities.

BURIAL RITUALS In addition to the threat of COVID-19 itself, many communities are working to adapt funerary and burial practices for COVID-19 victims. Traditional practices, including large gatherings and washing the deceased’s body, are common in many cultures, but these activities could pose transmission risk. Many countries and state/regional governments have implemented restrictions on funerals, including prohibitions on washing the body and limitations on the number of attendees, and domestic and international travel restrictions can make it difficult or impossible for family and friends who live elsewhere to attend the service. As we have seen in previous epidemics, such as the 2014-16 West Africa Ebola epidemic, communities are adapting to new burial processes, which likely do not conform to long-standing traditions. These changes can put additional stress on affected families and communities, compounding challenges in dealing with social distancing, economic damage, and other disruptions associated with the pandemic. Communities are working to balance the importance of providing a dignified burial for COVID-19 victims with the need to protect the health of families and communities, as well as the the religious leaders, morticians, and others who participate in funerary services.

Friday, August 28, 2020

August 27: University of Washington COVID-19 Projections

This is a work in Progress


Home

The projections from August 6 and August 21,are  projects through December 1, 2020.*  The other four projections are through November 1, 2020,  Georgia  has the highest projected death rate 2708 per million.  Projections rose by major proportions for Massachusetts, Arizona, District of Columbia, California, Illinois, South Carolina, Pennsylvania, Iowa, and North Dakota.  Decreases for Missouri, Kansas, Virginia and Wisconsin.

The August 21 projections are available from:  https://covid19.healthdata.org/united-states-of-america

                         July 7----July 14-----JULY 22------July 30—August 6*—August 21*—August 27*

United States  208,255,  224,546, 219,864,  230,822,  295,011,  309,918; NOW 317,312   Population 331.00 million  629.17 per million 678.39 per million, 664.24 per million, 697.35 per million, 891.17 per million, 936.3 per million, NOW 958.65 per million

Georgia  3,857  deaths; 4736;  7336; 10,278, 11,288,  10.805, NOW 12,410 Population 3.99 million   966.67 per million ; 1186 .97 per million;1838.60 per million; 2575.94 per million; 2829.07 per million; 2708.02 per million;  NOW 2110.28 per million

Massachusetts  12,906 deaths; 10,121 deaths ; 9970;   9647;  10,314;  12.295, NOW 12,410   Population 6.7 million  1926.27 per million 1510.60 per million; 1488.06 per million1439.85 per million; 1539.40 per million; 1835.07 per million; NOW 1852.24 per million

New York  32,221 deaths; 35,379; 35,039; 34,423;  33,945; 32,743, NOW 33,960  Population 18.8 million  1713.88 per million; 1881.86 per million; 1863.78 per million; 1836.33 per million;  1805.59 per million; 1741.65 per million; NOW 1806.38 per million

Louisiana   4,643 deaths; 5,167; 4955; 6401; 7901; 7840; NOW 7993  Population 4.6 million  1009.35  per million; 1123.26 per million; 1077.17 per million; 1391.52 per million;1717.61 per million; 1704.35 per million; NOW 1737.61 per million

California 16,827 deaths;  21,264; 19,572;  16,515;  32,692; 41,110; NOW 37,645   Population 39.78 million  423.00 per million;  534.54 per million;492.01 per million;  415.16 per million; 821.82 per million; 1033.43 per million; NOW 1497.52 per million

District of Columbia  666 deaths; 681 ; 694 ;  646; 605; 837; NOW 935 Population  .706 million  943.34 per million; 964.59 per million; 983.00 per million; 915.01 per million;  856.94 per million; 1185.55 per million; NOW 1324.36 per million

Connecticut  4,692  deaths; 4,456;  4750;  4844 5179;  4675; NOW 4626 deaths  Population  3.7 million   1268.11 per million; 1204.32 per million;1283.78 per million;  1309.19 per million; 1399.73 per million; 1263.52 per million; NOW  1250.27 per million

Illinois  8,907 deaths; 8,351;  8472 ;  8280;  9995; 11,071, NOW 15,058 Population 12.63 million  705.23 per million; 657.56 per million; 772.43 per million;  655.58 per million;  791.37 per million;  876.56 per million, NOW 1192.24 per million

Pennsylvania  9,999 deaths; 8,431; 8028;  8350; 8859; 14,998; 14,604; NOW 14,604   Population 12.7 million  787.32 per million; 663.86 per million; 632.13 per million;657.48 per million 697.56 per million; NOW 1180.94 per million;

Florida   17,477 deaths;19,285; 18,154,  16,318; 19,358; 21,174; NOW 24,532   Population 21.47 million  814.01 per million; 893.23 per million; 845.55 per million; 760.04 per million; 901.63 per million 986.21 per million; NOW 1142.63 per million

South Carolina 242 deaths; 4,556; 3186;  3232; 3672;  4724; NOW 5023   Population 5.0 million  48.4 per million; 911.20 per million;  637.2 per million;646.4 per million; 734.40 per million; 944.8 per million; NOW 1004.60 per million

Arizona  5,553 deaths; 5,177;  5664;7946 6840; 9562; NOW 7148;    Population 7.29 million  761.73 per million ;710.15 per million;  776.95 per million: 1089.97 per million; 938.27 per million.; 1311.66 per million; NOW 980.52 per million;

Iowa  841 deaths;  1,225; 1813,1700; 2163  2856; NOW 3077  Population 3.17 million  265.30 per million; 386.44 per million; 571.93 per million;  536.28 per million 682.34 per million;  900.95 per million; NOW 970.66 per million

Texas    13,450 deaths;18,675;  18,812; 24,557; 27,435; 25.532; NOW 27,194    Population 29.90 million  449.83 per million; 624.58 per million; 629.16 per million; 921.30 per million; 917.56 per million;  853.91 per million; NOW 909.50 per million

Missouri  5436 deaths; 3068; NOW 5231 Population 6.137 million; 885.77 per million; 499.92 per million, NOW 852.37 per million

Arkansas 724 deaths;  617, 895; 833; 2234;  2364; NOW 2406    Population 3.018 million  239.89 per million 204.44 per million; 293.55 per million;   276.01 per million ; 740.23 per million; 783.30 per million; NOW 797.22 per million

Oklahoma  587  deaths;1,029 ; 1533; 1484;   2967, 2058; NOW 3055 Population 4.0 million  146.75 per million 257.23 per million; 383.25 per million; 371.24 per million; 741.75 per million; 514.5 per million; NOW  763.75 per million

Maryland  3,880 deaths ; 4,278;  4194;  4026; 5174;  5301; NOW 4404 Population 6.0 million  646.67  per million; 713.00 per million; 699.0 per million;  671.0 per million;  862.34 per million; 883.5 per million; NOW 734 per million

Ohio  5,712  deaths;4,545;  3900;  5694; 9041;  6046; NOW 7564  Population 11.73 million  486.96 per million; 387.47 per million; 332.48 per million; 485.42 per million; 770.76 per million; 515.43 per million; NOW 644.84 per million

North Dakota 215 deaths; 371; NOW 491  Population .762 million 282.15 per million;486.88 per million; NOW 644.36 per million

Washington  2,510 deaths; 3,170; 3303; 2178; 5078; 5040; NOW 4410  Population 7.17 million  325.98 per million ;442.112 per million; 450.67 per million;  303.77 per million; 708.23 per million;  702.93 per million; NOW 615.06 per million

Oregon  471 deaths; 605;  683;  634; 2967;  2408; NOW 2395    Population 4.3 million  109.53 per million 140.70 per million;  158.84 per million; 147.44 per million; 690.0 per million; 560.0 per million; NOW 556.98 per million

Colorado  1937 deaths;  2,032; 2774:  2665; 5179;  2967; NOW 2395  Population 5.8 million  333.97 per million; 478.28 per million; NOW 459.48 per million; 892.93 per million’ 511.55 per million; NOW 412.93 per million

Wisconsin  1,410 deaths;  992; 1041; 2030; 3708 ;1775; NOW 2340 Population 5.82 million  242,27 per million 170.45 per million; 178.87 per million; 348.80 per million;  637.11 per million ; 304.98 per million; NOW 402.06 per million

Kansas 632 deaths ; 410;  412; 588; 2245; 1277; NOW 994  Population  2.77 million  228.16 per million 148.01 per million; 148.74 per million;  212.27 per million;  810.47 per million; 461.01 per million; NOW 358.84 per million

Virginia 5,190 deaths ;  4,881;  2643; 2289;  5842; 2828; NOW 2940   Population 8.63 million  601.39  per million ;565.59 per million; 306.26 per million:  265.24 per million; 676.94 per million;  327.69 per million; NOW 340.67 per million

South Dakota 254 deaths; 281; NOW 291  Population .885 million 287.01 per million;317.51 per million; NOW 328.81 per million

Idaho  120 deaths; 559; 513; 365;  916, 983: NOW 1373 Population 4.3 million  109.53 per million 140.70 per million;  158.84 per million;147.44 per million;  213.02 per million; 228.60 per million; NOW 319.30 per million

DEATHS

How many overall deaths will there be?

Our model is updated to account for new data and information, and the estimates may change as a result. For the latest estimate, visit our COVID-19 projections tool.


Why do your results show a wide range in the forecast for deaths?

Larger uncertainty intervals – or the range within which estimated deaths are likely to fall – can occur because of limited data availability, small studies, and conflicting data. A smaller range generally reflects extensive data availability, large studies, and data that are consistent across sources.


Why did the estimates for my location change?

To learn more, please visit our update page.


Why is the peak for daily deaths still forecast in the future when it looks like it has already occurred in my location?

The date of peak daily deaths depends on the model’s projections. If the model projects that the number of daily deaths will continue to rise, then the peak will be projected for a future date. It is important to note that the data on daily deaths may fluctuate dramatically due to irregularities in reporting. Health care workers are extremely busy caring for COVID-19 patients, so they may fall behind on reporting deaths. Once health care workers catch up on their reporting, however, it may appear as though there has been a spike in daily deaths.


Why are the “observed deaths” shown in your results for my location different from what is shown on the government’s official page?

For deaths, we primarily use the COVID-19 death data aggregated by the Johns Hopkins University (JHU) data repository (see "Where does IHME obtain its data?"). The JHU repository uses Coordinated Universal Time (UTC), which means new days start at 8 p.m. Eastern time. The JHU counts may differ slightly from local government data as a result of these timing differences. Also, the JHU repository is not necessarily synchronized to the update schedule of every location, so there may be a short lag that is reflected in a difference between our recorded daily deaths in a given location and those ultimately reported on government websites. Although this will be corrected when we update our analysis, in some cases, these differences may persist for several days.

Yet another reason why observed deaths may differ from numbers reported by governments is due to data processing. To address irregularities in the daily death data, we average data from the last three days to create a smooth version. To see the death data exactly as it is reported, 1) click the “Chart settings” icon in the upper right corner of the chart, and 2) turn off “Smoothed data.”


There are reports of deaths being under-reported in places. How does this impact your forecast?

We are learning that not all deaths due to COVID-19 that occur at home or in nursing homes have been attributed to COVID-19. As awareness increases, the number of reported deaths is growing, with some locations now reporting presumptive COVID-19 deaths. Another challenge is that COVID-19 death data fluctuate substantially each day, with some locations reporting more deaths on Tuesdays than on Sundays and Mondays. We believe this variation is due to data reporting practices instead of actual death patterns. To mitigate the impact of inconsistent reporting on our forecasts, our published predictions are based on averaging multiple iterations of projections. As new data emerges, we incorporate it into our model, and our projections will shift up or down in response to the data. To learn more, see our estimation updates.

For Ecuador and Peru in particular, the number of reported deaths due to COVID-19 appears to be improbably low. Instead of using reported COVID-19 deaths for these countries, we are approximating deaths from COVID-19. To approximate COVID-19 deaths, we used the number of excess deaths occurring in Ecuador and Peru during the COVID-19 pandemic and observations from other countries where we had weekly reports of total deaths and high-quality data on COVID-19 deaths.

August 28: Johns Hopkins COVID-19 Report

COVID-19

Updates on the emerging novel coronavirus pandemic from the Johns Hopkins Center for Health Security.

The Center for Health Security is analyzing and providing updates on the COVID-19 pandemic. If you would like to receive these updates, please subscribe below and select COVID-19. Additional resources are also available on our website.

Subscribe to our newsletter

The Johns Hopkins Center for Health Security also produces US Travel Industry and Retail Supply Chain Updates that provide a summary of major issues and events impacting the US travel industry and retail supply chain. You can access them here.

EPI UPDATE The WHO COVID-19 Dashboard reports 24.30 million cases (281,581 new) and 827,730 deaths (6,261 new) as of 10:30am EDT on August 26. The average global mortality has decreased from a peak of more than 6,300 new deaths per day on August 14 to 5,425 deaths per day now. If the global average remains greater than 5,000 deaths per day, the cumulative global mortality could reach 1 million deaths by the end of September.

Overall, the global daily COVID-19 mortality appears to be starting to decline, following a peak around mid-August. Asia is currently exhibiting the most notable increase in COVID-19 mortality, and South America appears to have reached a plateau. Since coming down from its first peak early in the pandemic, Europe has exhibited a very slow increase in mortality, up to 325 deaths per day from a low of 270 in late July. Mortality in Africa and North America peaked in mid-August and has declined steadily since then. Over the past 2 weeks, it appears that most countries are reporting decreasing COVID-19 mortality, an encouraging sign; however, numerous countries reported increases greater than 100% over that period. They are largely distributed around the world, but there is a noticeable concentration in Europe.

In total, there are 10 countries averaging more than 100 daily deaths. Brazil, India, and the US are all reporting essentially equal daily mortality, approximately 900-950 daily deaths. Mexico is reporting slightly more than half of that total, at 498 daily deaths, and Colombia is reporting 326 daily deaths. The remaining 5 countries are reporting fewer than 250 daily deaths. The Central and South America region represents 5 of the top 10 countries in terms of total daily mortality. In terms of per capita daily mortality, 10 countries are averaging 3 or more daily deaths per million population. Of these countries, 8 are from Central or South America. Also in the Americas, the Bahamas is #1 after jumping from just 1 daily death per million population to 10 in only 11 days, and the US falls just outside the top 10 (#12).

UNITED STATES

The US CDC removed its previous COVID-19 reporting page and transitioned to its COVID Data Tracker dashboard. The dashboard provides links to a variety of data, including incidence and mortality, laboratory testing, community impact (eg, mobility), and high-risk populations (eg, healthcare workers, incarcerated populations). Some of the data is available at the state and county level directly through the dashboard. The dashboard added a 7-day moving average for daily deaths, and it once again reports COVID-19 data from New York City and New York state separately.

The CDC reported 5.80 million total cases (46,393 new) and 178,998 deaths (1,239 new). In total, 19 states (no change) are reporting more than 100,000 cases, including California and Florida with more than 600,000 cases; Texas with more than 500,000; New York with more than 400,000; and Georgia and Illinois with more than 200,000. We expect Arizona to surpass 200,000 total cases in the coming days. Notably, the US fell out of the global top 10 in terms of per capita daily incidence.

Several US territories continue to report extremely high per capita daily incidence. Guam is reporting 446 new daily cases per million population, which would be #1 globally—more than 75% greater than the Maldives, the actual #1. It previously appeared as though much of Guam’s increased incidence was due to a large spike of 105 new cases reported on August 21; however, Guam has reported more than 50 new cases on 6 of the 7 days since then, including a new record high of 136 new cases on August 27. The US Virgin Islands is reporting 282 new daily cases per million population, which would also be #1 globally. Puerto Rico’s daily incidence has decreased over the past week or two, but it is still reporting 162 new daily cases per million population. This would put it at #10 globally, falling between Costa Rica and Spain.

The Johns Hopkins CSSE dashboard reported 5.88 million US cases and 181,092 deaths as of 12:30pm EDT on August 28.

SOUTH KOREA South Korea continues to report a resurgence of COVID-19, and it has experienced a range of disruptions and operational changes as a result of the increased transmission or response activities. The surge in incidence drove the Ministry of Health and Welfare to increase social distancing restrictions nationwide to Step 2 for a period of 2 weeks. On Thursday, proceedings of South Korea’s National Assembly were suspended in order to disinfect the building after a journalist tested positive for SARS-CoV-2. Additionally, the South Korean government ordered most schools in and around Seoul to close and transition classes online earlier this week. All students in the affected cities and provinces, with the exception of high school seniors, will participate in online classes through at least September 11. After delays and disruptions earlier in the year, South Korean schools reopened in late May and early June.

Earlier this week, physicians across the country, including in Seoul, engaged in a 3-day strike organized by the Korean Medical Association. The walkout of thousands of doctors, primarily interns and resident doctors at hospitals, stems from their disapproval of recent government decisions to increase the number of medical students admitted to medical schools in the future and to open a new public medical school for the purpose of expanding access to healthcare services nationally. The government also aims to expand insurance coverage to more traditional medicines and practices and increase the availability of telemedicine. The doctors reportedly disapprove of these plans because they believe they would unfairly increase competition in an already-crowded job market. They argue that the funding for these efforts would be better spent to increase salaries for trainees, which could enable them to move to rural areas that are experiencing a shortage of doctors. The strike has led to disruptions in hospital operations, leading facilities to reduce operating hours, cancel appointments, and delay procedures. South Korean Minister of Health Dr. Park Neung-hoo ordered protesting doctors to return to work, threatening those who do not comply with the possibility of suspending or revoking their licenses, fines of up to US$25,000, or up to 3 years in prison. To date, the government does not appear to have taken punitive action against striking doctors.

EUROPEAN SCHOOLS Like most of the rest of the world, European countries have been debating whether to reopen schools and how to best protect students and teachers. Public Health England conducted enhanced surveillance among schools that reopened between June 1-July 31 in order to provide better information regarding SARS-CoV-2 transmission risk in school settings. While approximately 80% of schools remained open in some capacity during the UK lockdown to support certain priority groups (eg, children of healthcare workers), the vast majority of children did not attend in-person classes. In June, the number of students attending schools increased from 475,000 to more than 1.6 million. The researchers identified 198 total COVID-19 cases over the study period, including 121 linked to 30 different outbreaks and 67 individual cases (ie, not linked to transmission in schools). An additional 10 cases were reported as "co-primary" cases, which were detected at the same time and had a common epidemiological link (eg, to a parent). Of these cases, 70 were students, and 128 were staff members. The study found a strong correlation between COVID-19 incidence in the region and the number of outbreaks in schools. The authors concluded that schools were associated with relatively few COVID-19 outbreaks after the easing of the lockdown, and the outbreaks that did occur were more likely to involve staff members. As a result of the correlation between school-based outbreaks and community transmission, the researchers emphasized the importance of community-based risk mitigation measures (eg, mask use, physical and social distancing). While the study provides evidence that schools do not drive transmission, Dr. Shamez Ladhani, one of the study’s authors, noted that the results reflect only data that were gathered right after the lockdown ended. Class sizes were very small at the time, and school-based transmission principally affected adult staff.

While it is possible that schools are not major drivers of transmission, Dr. Hans Kluge, the WHO Regional Director for Europe, stated that there is increasing evidence of children infecting others at social gatherings and that incidence among young people is increasing. The WHO recently advised that children 12 years and older should wear a mask under the same conditions as adults in order to mitigate transmission risk. As winter approaches in the Northern Hemisphere, there are concerns that increased close contact between children and more vulnerable older adults could lead to a rise in incidence and deaths.

In Germany, schools are beginning to reopen, with the majority of students returning for in-person classes. To mitigate transmission risk, German schools are reportedly focusing on improved ventilation and cohorting students (ie, keeping classes separate). The decision to bring all students back at once hinged partly on the number of available teachers, which did not support efforts to split students into smaller groups. Interestingly, masks are required on most school grounds in Germany, but not necessarily in classrooms in order to help students concentrate.

KENYA On Wednesday, Kenyan President Uhuru Kenyatta announced that Kenya is extending its current social distancing restrictions for 30 days. Kenya’s COVID-19 epidemic peaked in early August, at approximately 675 new cases per day, and it is now less than half of that (286 new cases per day) and still decreasing. In early July, despite several months of steadily increasing daily incidence, Kenya relaxed a number of social distancing measures in order to enable its economy to recover. Three (3) weeks later, however, President Kenyatta was forced to re-institute more restrictive measures to combat Kenya’s rapidly growing epidemic. He urged Kenyans to be vigilant in complying with the recommended actions, noting that they must all hold themselves and others accountable. The effort was successful in turning the tide against the COVID-19 epidemic, and in his most recent address, President Kenyatta applauded Kenyans’ efforts. He also continued to emphasize their personal responsibility and duty to protect others, “a happy debt to pay [their] fellow citizens.” While Kenya made considerable progress since the measures were implemented a month ago, he noted that much uncertainty remains about the future trajectory of the epidemic, encouraging Kenyans not to be complacent.

While some restrictions will remain intact, such as the nationwide 9pm-4am curfew, others will be relaxed to some degree. Bars and nightclubs will remain closed, but hotels will be permitted to serve alcohol. Additionally, the Ministry of Health will coordinate with bar owners to develop “self-regulating mechanisms” over the next 30 days with the aim of allowing them to resume operations. Restaurant hours of operation will still be restricted, but they will be permitted to extend closing by 1 hour, from 7pm to 8pm. Additionally, the limit on the attendance at weddings and funerals will increase to 100 people, and the Ministries of Health and Sports, Culture, and Heritage are expected to issue guidance for resuming sporting events.

WILD POLIO ELIMINATION IN AFRICA Earlier this week, the WHO announced that wild-type polio viruses have been eliminated from the continent of Africa, a major step toward eradication. Polio eradication programs, including vaccination campaigns, were suspended early in the COVID-19 pandemic due to concerns that the programs would not be able to continue in-person, door-to-door efforts safely in the midst of the pandemic, particularly that these efforts could inadvertently spread COVID-19 in vulnerable communities. Experts warned that scaling back eradication activities would inevitably result in polio outbreaks that could have lasting negative effects on eradication efforts. Polio vaccination programs began to resume in July, initially limited to outbreak response before expanding to include preventive campaigns.

In addition to contributing toward eradication, lessons and capacities from polio have been critical to the COVID-19 response in Africa. Over its history, polio eradication efforts have incorporated a myriad of other healthcare and public health benefits—including mosquito nets, vitamin A, and other vaccinations—and this approach is now being applied to the COVID-19 response. Additionally, it is critical to establish trusted relationships with local leaders, which helps establish inroads with affected communities, implement culturally appropriate interventions, and build public confidence in the response efforts, including contact tracing and vaccination. The laboratory network and infrastructure established for polio is also being utilized for COVID-19. The network includes 16 laboratories across 15 countries in Africa, and 50% of its capacity has been transitioned to support SARS-CoV-2 testing. Leveraging existing capacity and expertise, such as through polio eradication efforts, is critical to making efficient use of available resources.

CHINA SCHOOLS REOPENING China is expected to fully reopen schools next week. China has already opened schools for 75% of students, and this move will ultimately enable all students to resume in-person classes. China’s school systems include nearly 300 million teachers and students nationwide. According to China’s Ministry of Education, no cases of COVID-19 have been detected at schools during the initial phases of resuming in-person classes, through the point of reaching 75% capacity. The Ministry of Education emphasized that conditions at schools across the country may vary and that schools cannot take a “one size fits all” approach to implementing appropriate COVID-19 protective measures. It also emphasizes the importance of local control of COVID-19 transmission, much like the US CDC emphasizes the need to account for risks associated with local community transmission as students resume in-person classes. Colleges and universities have been directed to strictly control access to campus, including checking identification for students and teachers and limiting visitors, in order to mitigate the risk of introducing SARS-CoV-2. While all schools will reportedly be open, it may still take time for all students to resume in-person classes. According to information published by the Ministry of Education, schools will phase in their students, and provincial plans could take as long as 37 days to reach 100% capacity. Including colleges and universities, the phase-in period is scheduled to continue into mid-October.

RAPID ANTIGEN TEST EUA The US FDA issued an Emergency Use Authorization (EUA) for a rapid antigen test developed by Abbott Laboratories that can return results in approximately 15 minutes. The test uses widely available testing equipment, as opposed to proprietary reagents or machines, and it can be performed on site at the point of care. A press release from Abbott indicates that the test has demonstrated reasonably high sensitivity (97.1%) and specificity (98.5%). Antigen tests detect the presence of viral particles, including specific proteins, whereas traditional PCR tests detect the presence of viral RNA. Antigen tests can be performed more quickly than PCR tests, but they tend to be less accurate. The test is projected to cost US$5 each, which could help make it more widely available, and it will have an accompanying smartphone application that will enable individuals to present documentation of recent negative tests. The US government finalized an agreement to purchase 150 million tests, at a cost of US$750 million. Widespread distribution of these tests would substantially increase national testing capacity, and rapid, on-site testing capability would dramatically decrease the delays in processing tests and return results that continue to plague PCR-based diagnostic tests.

The test has been described by some, including US Assistant Secretary for Health Admiral Brett Giroir, as a “game changer”; however, there are some notable limitations that should be considered as well. The ability to use widely available testing equipment expands the number of laboratories that could perform the test, but the test still requires a laboratory and trained personnel to conduct it, as well as a nasopharyngeal swab to obtain the specimen. It is not a test that individuals can take at home. Additionally, the US$5 cost pertains only to the test, and the cost of personnel time and laboratory testing supplies and equipment will likely increase the overall cost. The test is also limited to symptomatic individuals, and as we have covered previously, asymptomatic or presymptomatic transmission is a major driver of the COVID-19 pandemic. A number of other relatively inexpensive, rapid antigen tests are currently in development, including some that are designed for home use.

**While this is largely a US issue, we are continuing to cover emerging information regarding recent US CDC changes to SARS-CoV-2 testing guidance.**

US CDC TESTING GUIDANCE Multiple reports indicate that the changes to the US CDC’s SARS-CoV-2 testing guidance—in particular, that asymptomatic individuals “do not necessarily need a test,” even if they have known exposure to a COVID-19 case—were directed by senior US government leadership outside the CDC. The changes were reportedly made under pressure by senior officials at the Department of Health and Human Services and the White House coronavirus task force. Notably, several reports also indicate that Dr. Anthony Fauci was undergoing surgery at the time of these discussions and did not sign off on the changes. This conflicts directly with statements made by Admiral Brett Giroir, the Assistant Secretary for Health and the “coronavirus testing czar,” who stated that “all the doc[tors] signed off” on the new guidance and that the updates represent an “absolute consensus” by the US government’s top experts.

Multiple experts have commented that these reports raise serious concerns that the changes may have been made on the basis of political pressure rather than available scientific evidence. President Donald Trump has repeatedly stated that he would like to see reduced testing in order to decrease the reported COVID-19 incidence, which would likely have serious negative effects on the US response. Late Wednesday evening, CDC Director Dr. Robert Redfield issued a statement in support of the new guidance. In his statement, Dr. Redfield noted that “testing is meant to drive actions and achieve specific public health objectives”; however, it is unclear how health officials could effectively conduct actions such as contact tracing and notifying individuals who were exposed to asymptomatic infections if no testing is conducted.