Monday, April 6, 2020

Washington returning some ventilators


Washington sending over 400 ventilators for non-coronavirus patients to New York, harder hit states

April 5, 2020 at 12:39 pm Updated April 5, 2020 at 3:53 pm
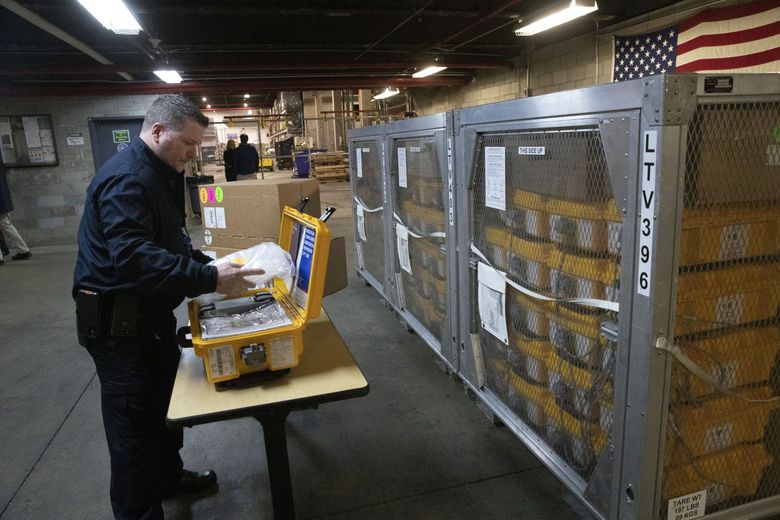
Vincent Dellova, a coordinator at the New York City Emergency Management Warehouse, packs up a ventilator, part of a shipment of 400, that arrived Tuesday, March 24, 2020 in New York.  (Mark Lennihan / AP)Vincent Dellova, a coordinator at the New York City Emergency Management Warehouse, packs up a ventilator, part of a shipment of 400, that arrived Tuesday, March 24,... (Mark Lennihan / AP) More

David Gutman

By

David Gutman

Seattle Times staff reporter

Washington will return more than 400 of the 500 ventilators it recently received from the federal government, so they can go to New York and other states harder hit by the coronavirus crisis, Gov. Jay Inslee said Sunday.

After requesting 1,000 ventilators from the Strategic National Stockpile, Washington last month received 500.

The National Stockpile ventilators are not suitable for treating COVID-19 patients, state officials said. That’s because those individuals generally need a higher amount of pressure support into their lungs than the ventilators from the national stockpile can provide, said Jessica Baggett, a spokeswoman for the state’s Joint Information Center.

The stockpile ventilators, though, can be used for other patients, freeing up more COVID-19 compatible ventilators to help with the crisis.

The decision to return the ventilators comes five weeks after the first coronavirus death in Washington, when Inslee declared a state of emergency. It offers a glimmer of hope that the drastic steps the state has taken since then — shutting down schools and nonessential businesses and grinding daily life to a halt — have helped forestall the bleakest possible outcomes.

Dr. Raquel Bono, the retired Navy vice admiral leading the state’s coronavirus response, said in a statement that they’d made the decision to send off the ventilators after conferring with the Washington State Hospital Association. She said the state’s aggressive social-distancing actions have slowed the virus’ growth here.


“We have seen fewer infections in our communities than anticipated,” Bono said. “Our current status allows us to help others who have a more immediate need.”

Hospitalizations for patients with COVID-19-like illnesses declined by more than 20% in Washington in the last week of March, a small hopeful sign. And the Army Corps of Engineers has built a 250-bed field hospital at the CenturyLink Field Event Center to handle a potential overflow of non-COVID patients.

All 500 ventilators from the national stockpile had been distributed to hospitals across the state, a spokeswoman said, and the state was in the process of recalling them Sunday. Washington has also purchased more than 750 ventilators, which are expected to arrive over the next several weeks, Inslee’s office said.

“I’ve said many times over the last few weeks, we are in this together,” Inslee said in a prepared statement Sunday. “This should guide all of our actions at an individual and state level in the coming days and weeks.”

At the same time, on Sunday, Inslee reiterated his call for President Donald Trump to order the nation’s manufacturers to start producing more masks, face shields and testing materials. He faulted the Trump administration for what he called a lack of leadership during the pandemic, leaving states to scramble and compete with each other for such protective equipment.

“I mean, the surgeon general alluded to Pearl Harbor,” Inslee said on “Meet The Press” on Sunday. “Can you imagine if Franklin Delano Roosevelt said, ‘I’ll be right behind you, Connecticut. Good luck building those battleships.’”

Cassie Sauer, president and CEO of the Washington State Hospital Association, said hospitals here are not experiencing the dire needs for ventilators that New York hospitals are seeing.


“Sending some of our ventilator supply where it was immediately needed seemed like the right thing to do to support others across the country,” Sauer said.

Judith Malmgren, a Seattle epidemiologist, said Washington seems to be in good shape to send the ventilators back, even though we’re not seeing the number of new daily confirmed cases decline yet.

“They’re stable and the number of beds and the hospitals are not over capacity,” Malmgren said. She also noted that a majority of confirmed cases are now in people younger than 60, meaning they’re less likely to require hospitalization, a reversal since the earliest days of the crisis.

Dr. Arnold Monto, a professor of epidemiology and global health at the University of Michigan, said the state’s return of the ventilators was a cause for optimism.

“Seattle did what it needs to do,” Monto said. “The important thing is to watch the curve. The peak may be of different height in different places because of local factors.”

Washington joins Oregon, which on Saturday announced it would send 140 ventilators to New York, as states that have managed to slow new infections enough that the most dire predictions may be averted.

“We’ll be sending 140 ventilators to help NY because Oregon is in a better position right now,” Oregon Gov. Kate Brown tweeted Saturday. “Oregon doesn’t have everything we need to fight COVID-19 — we need more PPE and testing — but we can help today with ventilators. We are all in this together.”

Inslee has also been very cautiously hopeful.

“We have had some success flattening the curve. That has taken place because we acted relatively early,” he said Sunday. “But I want to reiterate, we are a long ways away from being out of the woods. We have not got down to anywhere close to where we need to be to declare victory of this horrendous virus.”

David Gutman: 206-464-2926 or dgutman@seattletimes.com; on Twitter: @davidlgutman.

ABOVE IS FROM:  https://www.seattletimes.com/seattle-news/health/washington-sending-over-400-ventilators-for-non-coronavirus-patients-to-new-york-harder-hit-states/?utm_source=marketingcloud&utm_medium=email&utm_campaign=Morning+Brief+4-6-20_4_6_2020&utm_term=

Sunday, April 5, 2020

Projections from University of Washington Study: April 5

Projections from University of Washington Study
FROM:  http://www.healthdata.org/research-article/forecasting-covid-19-impact-hospital-bed-days-icu-days-ventilator-days-and-deaths
Home

Major decrease in projections for State of California and Washington thus US death projection is down..

PROJECTION:

As of April 5, 2020

United States of America:  (81,766 4-5-2020) (93,531 4-4-2020) (93,765 4-1-2020)  Deaths

>Population 331 Millions  (2020) 

*******************************************************************************************************8

California:  (1,783 Deaths   4-5-2020) (5,068 4-3-2020) (5,161 4-1-2020)

>39.56 millions (2018)

Florida:  (6770 deaths 4-5-2020) (6,897 4-3-2022)(6,937 4-1-2020)

>Population  21.3 million (2018)

Illinois: (3,629 deaths 4-5-2020)(3,386  4-3-2020) (2786 4-1-2020)

>12.74 million (2018)

Louisiana: 746 deaths 4-5-2020

>4.6 million (2018)

Ohio:  544

>11.69 million (2018)

Massachusetts  8,254 deaths

>6.9 million (2018)

Michigan  2,963 deaths

>9.996 million (2018)

New York: (15,618 deaths 4-5-2020) (16,261 4-3-2020) (16,090 4-1-2020)

>19.54 million (2018)

Texas:  (2,025 4-5-2020)

>28,7 million (2018)

Washington:  632 deaths 4-5-2020) (978 4-3-2020) (1,233 4-1-2020)

>7.536 million (2018)

Wisconsin:  (644 deaths 4-5-2020) (951 4-3-2020) (926 4-1-2020)

>5.814 Million (2018)

April 5: 11,256 COVID-19 cases in Illinois

In response to the COVID-19 pandemic, Gov. JB Pritzker has ordered Illinois residents to stay at home. Executive Order No. 10 requires all residents to stay home, with exceptions for essential needs or business activities. Gatherings of 10 people or more are prohibited. The order extends through April 30, 2020.
Coronavirus Disease 2019 (COVID-19) in Illinois Test Results
Positive
(11,256  4-5-2020) (10,357 4/4/2020) (8,904-- 4/3/2020) (7,695-- 4/2/2020)   (6,980-- 4/1/2020) (5,994-- 3/31/2020)  (5,05--7 3/30/2020) (4,596-- 3/29/2020)
Deaths
(274  4-5-2020) (243—4-4-2020) (210-- 4-3-2020) (157 4-2-2020)(141 4/1/2020) (99 3/31/2020) (73 3/30/2020)  (65 3/29/2020)
Total Persons Tested*
(58,983  4-5-2020) (53,581—4-4-2020)  (48,048-- 4-3-2020) (43,653-- 4/2/2020) (40,384-- 4/1/2020) (35,225-- 3-31-2020) (30,446-- 3/30/2020)  (27,762-- 3/29/2020)

*Total number of people reported electronically for testing of COVID-19 at IDPH, commercial or hospital laboratories. Deaths are included in the number of positive cases
All numbers displayed are provisional and subject to change.

Information regarding the number of people under investigation updated on 3/30/2020.
Information to be updated daily.

Above is from:  http://www.dph.illinois.gov/topics-services/diseases-and-conditions/diseases-a-z-list/coronavirus

*****************************************************************************************************************************

Increase in Illinois projected deaths; peak changed to higher number 8 days earlier.

The University of Washington model has a large increase in total deaths for Illinois and places peak date of cases two days later than on March 31 when it was 4-16-2020

PROJECTIONS from:  http://www.healthdata.org/research-article/forecasting-covid-19-impact-hospital-bed-days-icu-days-ventilator-days-and-deaths

Total COVID-19 deaths projected through August 4, 2020 in Illinois

(3,629 4-5-2020)(3,386 4-2-2020) (2,789 4-1-2020)  (2,326  3-31-2020)  (2,369 as of 3/30/2020)  (2,454 AS OF 3-26-2020)   

COVID-19 deaths   Peak deaths  (208 on 4-12-2020) (109 on 4-20-2020)

For a lengthier discussion of the projection model go to:  http://boonecountywatchdog.blogspot.com/2020/03/forecasting-covid-19-impact-on-hospital.html

****************************************************************************************************************************************************************

Cases in U.S.

Updated  April 5, 2020

This page will be updated daily. Numbers close out at 4 p.m. the day before reporting.

***On Saturday and Sunday, the numbers in COVID-19: U.S. at a Glance and the figure describing the cumulative total number of COVID-19 cases in the United States will be updated. These numbers are preliminary and have not been confirmed by state and territorial health departments. CDC will update weekend numbers the following Monday to reflect health department updates.***

CDC is responding to an outbreak of respiratory illness caused by a novel (new) coronavirus. The outbreak first started in Wuhan, China, but cases have been identified in a growing number of other locations internationally, including the United States. In addition to CDC, many public health laboratories are now testing for the virus that causes COVID-19.

COVID-19: U.S. at a Glance*†

  • Total cases : (304,826  4-5-2020) (277,205 4-4-2020) (239,279 4-3-2020) (213,144 4/2/2020)(186,101 4/1/2020) (163,539 3/31/2020) (140,904 3/30/2020)   (122,653  3-29-2020)
  • Total deaths:  (7,616 4-5-2020)  (6, 593 4-4-2020) (5,443 4-3-2020) (4,513 4-2-2020) (3,603 4-1-2020) (2,860 3/31/2020) (2,405 3/30/2020)   (2,112  3-29-2020)
  • Jurisdictions reporting cases: 55 (50 states, District of Columbia, Puerto Rico, Guam, Northern Marianas, and US Virgin Islands)

* Data include both confirmed and presumptive positive cases of COVID-19 reported to CDC or tested at CDC since January 21, 2020, with the exception of testing results for persons repatriated to the United States from Wuhan, China and Japan. State and local public health departments are now testing and publicly reporting their cases. In the event of a discrepancy between CDC cases and cases reported by state and local public health officials, data reported by states should be considered the most up to date.

† Numbers updated Saturday and Sunday are not confirmed by state and territorial health departments. These numbers will be modified when numbers are updated on Monday.(

Cases of COVID-19 Reported in the US, by Source of Exposure*†

* Data include both confirmed and presumptive positive cases of COVID-19 reported to CDC or tested at CDC since January 21, 2020, with the exception of testing results for persons repatriated to the United States from Wuhan, China and Japan. State and local public health departments are now testing and publicly reporting their cases. In the event of a discrepancy between CDC cases and cases reported by state and local public health officials, data reported by states should be considered the most up to date.

† CDC is no longer reporting the number of persons under investigation (PUIs) that have been tested, as well as PUIs that have tested negative. Now that states are testing and reporting their own results, CDC’s numbers are not representative of all testing being done nationwide.

Above is from:  https://www.cdc.gov/coronavirus/2019-ncov/cases-updates/cases-in-us.html


***********************************************************************************************************************************************************

Sizeable decrease in estimated US deaths, peak is now extended by 16 days but somewhat higher.


PROJECTIONS:   US COVID-19 Deaths thru 8-4-2020: (81,766 4-5-2020) (93,531 4/3/2020) (93,765 4/1/2020)   (83.967 3/31/2020)    ( 82,141 3/30/2020);  Peak Daily 2,644 on 4-16-2020

Older Peak Daily Deaths  (3,130 on 4-16-2020) ( 2214 on 3/31/2020) (2,214 on 3/31/2020) (2,271 3/30/2020)

Saturday, April 4, 2020

April 4: 10,357 COVID-19 cases in Illinois

In response to the COVID-19 pandemic, Gov. JB Pritzker has ordered Illinois residents to stay at home. Executive Order No. 10 requires all residents to stay home, with exceptions for essential needs or business activities. Gatherings of 10 people or more are prohibited. The order extends through April 30, 2020.
Coronavirus Disease 2019 (COVID-19) in Illinois Test Results
Positive
(10,357 4/4/2020) (8,904-- 4/3/2020) (7,695-- 4/2/2020)   (6,980-- 4/1/2020) (5,994-- 3/31/2020)  (5,05--7 3/30/2020) (4,596-- 3/29/2020)
Deaths
(243—4-4-2020) (210-- 4-3-2020) (157 4-2-2020)(141 4/1/2020) (99 3/31/2020) (73 3/30/2020)  (65 3/29/2020)
Total Persons Tested*
(53,581—4-4-2020)  (48,048-- 4-3-2020) (43,653-- 4/2/2020) (40,384-- 4/1/2020) (35,225-- 3-31-2020) (30,446-- 3/30/2020)  (27,762-- 3/29/2020)

*Total number of people reported electronically for testing of COVID-19 at IDPH, commercial or hospital laboratories. Deaths are included in the number of positive cases
All numbers displayed are provisional and subject to change.

Information regarding the number of people under investigation updated on 3/30/2020.
Information to be updated daily.

Above is from:  http://www.dph.illinois.gov/topics-services/diseases-and-conditions/diseases-a-z-list/coronavirus

*****************************************************************************************************************************

The University of Washington model has a large increase in total deaths for Illinois and places peak date of cases two days later than on March 31 when it was 4-16-2020

PROJECTIONS from:  http://www.healthdata.org/research-article/forecasting-covid-19-impact-hospital-bed-days-icu-days-ventilator-days-and-deaths

Total COVID-19 deaths projected through August 4, 2020 in Illinois

(3,386 4-2-2020) (2,789 4-1-2020)  (2,326  3-31-2020)  (2,369 as of 3/30/2020)  (2,454 AS OF 3-26-2020)    

COVID-19 deaths   Peak deaths 109 on 4-20-2020

For a lengthier discussion of the projection model go to:  http://boonecountywatchdog.blogspot.com/2020/03/forecasting-covid-19-impact-on-hospital.html

****************************************************************************************************************************************************************

Cases in U.S.

Updated  April 4, 2020

This page will be updated daily. Numbers close out at 4 p.m. the day before reporting.

***On Saturday and Sunday, the numbers in COVID-19: U.S. at a Glance and the figure describing the cumulative total number of COVID-19 cases in the United States will be updated. These numbers are preliminary and have not been confirmed by state and territorial health departments. CDC will update weekend numbers the following Monday to reflect health department updates.***

CDC is responding to an outbreak of respiratory illness caused by a novel (new) coronavirus. The outbreak first started in Wuhan, China, but cases have been identified in a growing number of other locations internationally, including the United States. In addition to CDC, many public health laboratories are now testing for the virus that causes COVID-19.

COVID-19: U.S. at a Glance*†

  • Total cases : (277,205 4-4-2020) (239,279 4-3-2020) (213,144 4/2/2020)(186,101 4/1/2020) (163,539 3/31/2020) (140,904 3/30/2020)   (122,653  3-29-2020)
  • Total deaths:  (6,593 4-4-2020) (5,443 4-3-2020) (4,513 4-2-2020) (3,603 4-1-2020) (2,860 3/31/2020) (2,405 3/30/2020)   (2,112  3-29-2020)
  • Jurisdictions reporting cases: 55 (50 states, District of Columbia, Puerto Rico, Guam, Northern Marianas, and US Virgin Islands)

* Data include both confirmed and presumptive positive cases of COVID-19 reported to CDC or tested at CDC since January 21, 2020, with the exception of testing results for persons repatriated to the United States from Wuhan, China and Japan. State and local public health departments are now testing and publicly reporting their cases. In the event of a discrepancy between CDC cases and cases reported by state and local public health officials, data reported by states should be considered the most up to date.

† Numbers updated Saturday and Sunday are not confirmed by state and territorial health departments. These numbers will be modified when numbers are updated on Monday.(

Cases of COVID-19 Reported in the US, by Source of Exposure*†

* Data include both confirmed and presumptive positive cases of COVID-19 reported to CDC or tested at CDC since January 21, 2020, with the exception of testing results for persons repatriated to the United States from Wuhan, China and Japan. State and local public health departments are now testing and publicly reporting their cases. In the event of a discrepancy between CDC cases and cases reported by state and local public health officials, data reported by states should be considered the most up to date.

† CDC is no longer reporting the number of persons under investigation (PUIs) that have been tested, as well as PUIs that have tested negative. Now that states are testing and reporting their own results, CDC’s numbers are not representative of all testing being done nationwide.

Above is from:  https://www.cdc.gov/coronavirus/2019-ncov/cases-updates/cases-in-us.html

***********************************************************************************************************************************************************

PROJECTIONS:   US COVID-19 Deaths thru 8-4-2020:  (93,531 4/3/2020) (93,765 4/1/2020)   (83.967 3/31/2020)    ( 82,141 3/30/2020);  Peak Daily 2,644 on 4-16-2020

Older Peak Daily Deaths( 2214 on 3/31/2020) (2,214 on 3/31/2020) (2,271 3/30/2020)

Friday, April 3, 2020

Projections from University of Washington Study 4-3-2020

Projections from University of Washington Study
FROM:  http://www.healthdata.org/research-article/forecasting-covid-19-impact-hospital-bed-days-icu-days-ventilator-days-and-deaths
Home

Major decrease in projections for State of Washington

PROJECTION:

As of April 3, 2020

United States of America:  93,531 (93,765 4-1-2020)  Deaths

>Population 331 Millions  (2020)

*******************************************************************************************************8

California:  5,068 Deaths (5,161 4-1-2020)

>39.56 millions (2018)

Florida: 6,897 deaths (6,937 4-1-2020)

>Population  21.3 million (2018)

Illinois: 3,386 deaths (2786 4-1-2020)

>12.74 million (2018)

New York: 16,261 deaths(16,090 4-1-2020)

>19.54 million (2018)

Washington:  978 deaths (1,233 4-1-2020)

>7.536 million (2018)

Wisconsin:  951 deaths (926 4-1-2020)

>5.814 Million (2018)

April 3: 8,904 COVID-19 cases in Illinois


In response to the COVID-19 pandemic, Gov. JB Pritzker has ordered Illinois residents to stay at home. Executive Order No. 10 requires all residents to stay home, with exceptions for essential needs or business activities. Gatherings of 10 people or more are prohibited. The order extends through April 7, 2020.
Coronavirus Disease 2019 (COVID-19) in Illinois Test Results
Positive
(8,904 4/3/2020) (7,695 4/2/2020)   (6,980 4/1/2020) (5,994 3/31/2020)  (5,057 3/30/2020) (4,596 3/29/2020)
Deaths
(210  4-3-2020) (157 4-2-2020)(141 4/1/2020) (99 3/31/2020) (73 3/30/2020)  (65 3/29/2020)
Total Persons Tested*
(48,048 4-3-2020) (43,653 4/2/2020) (40,384 4/1/2020) (35,225 3-31-2020) (30,446 3/30/2020)  (27,762 3/29/2020)

*Total number of people reported electronically for testing of COVID-19 at IDPH, commercial or hospital laboratories. Deaths are included in the number of positive cases
All numbers displayed are provisional and subject to change.

Information regarding the number of people under investigation updated on 3/30/2020.
Information to be updated daily.

Above is from:  http://www.dph.illinois.gov/topics-services/diseases-and-conditions/diseases-a-z-list/coronavirus

*****************************************************************************************************************************

The University of Washington model has a large increase in total deaths for Illinois and places peak date of cases two days later than on March 31 when it was 4-16-2020

PROJECTIONS from:  http://www.healthdata.org/research-article/forecasting-covid-19-impact-hospital-bed-days-icu-days-ventilator-days-and-deaths

Total COVID-19 deaths projected through August 4, 2020 in Illinois

(3,386 4-2-2020) (2,789 4-1-2020)  (2,326  3-31-2020)  (2,369 as of 3/30/2020)  (2,454 AS OF 3-26-2020)     

COVID-19 deaths   Peak deaths 109 on 4-20-2020

For a lengthier discussion of the projection model go to:  http://boonecountywatchdog.blogspot.com/2020/03/forecasting-covid-19-impact-on-hospital.html

****************************************************************************************************************************************************************

Cases in U.S.

Updated  April 2, 2020

This page will be updated daily. Numbers close out at 4 p.m. the day before reporting.

***On Saturday and Sunday, the numbers in COVID-19: U.S. at a Glance and the figure describing the cumulative total number of COVID-19 cases in the United States will be updated. These numbers are preliminary and have not been confirmed by state and territorial health departments. CDC will update weekend numbers the following Monday to reflect health department updates.***

CDC is responding to an outbreak of respiratory illness caused by a novel (new) coronavirus. The outbreak first started in Wuhan, China, but cases have been identified in a growing number of other locations internationally, including the United States. In addition to CDC, many public health laboratories are now testing for the virus that causes COVID-19.

COVID-19: U.S. at a Glance*†

  • Total cases : (239,279 4-3-2020) (213,144 4/2/2020)(186,101 4/1/2020) (163,539 3/31/2020) (140,904 3/30/2020)   (122,653  3-29-2020)
  • Total deaths (5,443 4-3-2020) (4,513 4-2-2020) (3,603 4-1-2020) (2,860 3/31/2020) (2,405 3/30/2020)   (2,112  3-29-2020)
  • Jurisdictions reporting cases: 55 (50 states, District of Columbia, Puerto Rico, Guam, Northern Marianas, and US Virgin Islands)

* Data include both confirmed and presumptive positive cases of COVID-19 reported to CDC or tested at CDC since January 21, 2020, with the exception of testing results for persons repatriated to the United States from Wuhan, China and Japan. State and local public health departments are now testing and publicly reporting their cases. In the event of a discrepancy between CDC cases and cases reported by state and local public health officials, data reported by states should be considered the most up to date.

† Numbers updated Saturday and Sunday are not confirmed by state and territorial health departments. These numbers will be modified when numbers are updated on Monday.(

Cases of COVID-19 Reported in the US, by Source of Exposure*†

* Data include both confirmed and presumptive positive cases of COVID-19 reported to CDC or tested at CDC since January 21, 2020, with the exception of testing results for persons repatriated to the United States from Wuhan, China and Japan. State and local public health departments are now testing and publicly reporting their cases. In the event of a discrepancy between CDC cases and cases reported by state and local public health officials, data reported by states should be considered the most up to date.

† CDC is no longer reporting the number of persons under investigation (PUIs) that have been tested, as well as PUIs that have tested negative. Now that states are testing and reporting their own results, CDC’s numbers are not representative of all testing being done nationwide.

Above is from:  https://www.cdc.gov/coronavirus/2019-ncov/cases-updates/cases-in-us.html

***********************************************************************************************************************************************************

PROJECTIONS:   US COVID-19 Deaths thru 8-4-2020:  (93,531 4/3/2020) (93,765 4/1/2020)   (83.967 3/31/2020)    ( 82,141 3/30/2020);  Peak Daily 2,644 on 4-16-2020

Older Peak Daily Deaths( 2214 on 3/31/2020) (2,214 on 3/31/2020) (2,271 3/30/2020)

Thursday, April 2, 2020

April 2: 7,695 Illinois COVID-19 cases


In response to the COVID-19 pandemic, Gov. JB Pritzker has ordered Illinois residents to stay at home. Executive Order No. 10 requires all residents to stay home, with exceptions for essential needs or business activities. Gatherings of 10 people or more are prohibited. The order extends through April 7, 2020.
Coronavirus Disease 2019 (COVID-19) in Illinois Test Results
Positive
(7,695 4/2/2020)   (6,980 4/1/2020) (5,994 3/31/2020)  (5,057 3/30/2020) (4,596 3/29/2020)
Deaths
(157 4-2-2020)(141 4/1/2020) (99 3/31/2020) (73 3/30/2020)  (65 3/29/2020)
Total Persons Tested*
(43,653 4/2/2020) (40,384 4/1/2020) (35,225 3-31-2020) (30,446 3/30/2020)  (27,762  3/29/2020)

*Total number of people reported electronically for testing of COVID-19 at IDPH, commercial or hospital laboratories. Deaths are included in the number of positive cases
All numbers displayed are provisional and subject to change.

Information regarding the number of people under investigation updated on 3/30/2020.
Information to be updated daily.

Above is from:  http://www.dph.illinois.gov/topics-services/diseases-and-conditions/diseases-a-z-list/coronavirus

*****************************************************************************************************************************

The University of Washington model has a large increase in total deaths for Illinois and places peak date of cases two days later than on March 31 when it was 4-16-2020

PROJECTIONS from:  http://www.healthdata.org/research-article/forecasting-covid-19-impact-hospital-bed-days-icu-days-ventilator-days-and-deaths

Total COVID-19 deaths projected through August 4, 2020 in Illinois

(3,386 4-2-2020) (2,789 4-1-2020)  (2,326  3-31-2020)  (2,369 as of 3/30/2020)  (2,454 AS OF 3-26-2020)      

COVID-19 deaths   Peak deaths 109 on 4-20-2020

For a lengthier discussion of the projection model go to:  http://boonecountywatchdog.blogspot.com/2020/03/forecasting-covid-19-impact-on-hospital.html

****************************************************************************************************************************************************************

Cases in U.S.

Updated  April 2, 2020

This page will be updated daily. Numbers close out at 4 p.m. the day before reporting.

***On Saturday and Sunday, the numbers in COVID-19: U.S. at a Glance and the figure describing the cumulative total number of COVID-19 cases in the United States will be updated. These numbers are preliminary and have not been confirmed by state and territorial health departments. CDC will update weekend numbers the following Monday to reflect health department updates.***

CDC is responding to an outbreak of respiratory illness caused by a novel (new) coronavirus. The outbreak first started in Wuhan, China, but cases have been identified in a growing number of other locations internationally, including the United States. In addition to CDC, many public health laboratories are now testing for the virus that causes COVID-19.

COVID-19: U.S. at a Glance*†

  • Total cases : (213,144 4/2/2020)(186,101 4/1/2020) (163,539 3/31/2020) (140,904 3/30/2020)   (122,653  3-29-2020)
  • Total deaths: (4,513 4-2-2020) (3,603 4-1-2020) (2,860 3/31/2020) (2,405 3/30/2020)   (2,112  3-29-2020)
  • Jurisdictions reporting cases: 55 (50 states, District of Columbia, Puerto Rico, Guam, Northern Marianas, and US Virgin Islands)

* Data include both confirmed and presumptive positive cases of COVID-19 reported to CDC or tested at CDC since January 21, 2020, with the exception of testing results for persons repatriated to the United States from Wuhan, China and Japan. State and local public health departments are now testing and publicly reporting their cases. In the event of a discrepancy between CDC cases and cases reported by state and local public health officials, data reported by states should be considered the most up to date.

† Numbers updated Saturday and Sunday are not confirmed by state and territorial health departments. These numbers will be modified when numbers are updated on Monday.(

Cases of COVID-19 Reported in the US, by Source of Exposure*†

* Data include both confirmed and presumptive positive cases of COVID-19 reported to CDC or tested at CDC since January 21, 2020, with the exception of testing results for persons repatriated to the United States from Wuhan, China and Japan. State and local public health departments are now testing and publicly reporting their cases. In the event of a discrepancy between CDC cases and cases reported by state and local public health officials, data reported by states should be considered the most up to date.

† CDC is no longer reporting the number of persons under investigation (PUIs) that have been tested, as well as PUIs that have tested negative. Now that states are testing and reporting their own results, CDC’s numbers are not representative of all testing being done nationwide.

Above is from:  https://www.cdc.gov/coronavirus/2019-ncov/cases-updates/cases-in-us.html

***********************************************************************************************************************************************************

PROJECTIONS:   US COVID-19 Deaths thru 8-4-2020:  (93,531 4/2/2020) (93,765 4/1/2020)   (83.967 3/31/2020)    ( 82,141 3/30/2020);  Peak Daily 2,644 on 4-16-2020

Older Peak Daily Deaths (2,214 on 3/31/2020) (2,271 3/30/2020)