Great article which relates the importance of testing. But remember the data is from 4-13-2020.
The complete article is available at: http://www.msn.com/en-us/health/health-news/states-with-the-highest-number-of-covid-19-cases-per-capita/ss-BB1337e3?li=BBnb7Kz&ocid=UE13DHP Below is the portion concerning individual US states.
***************************************************************************************************************************************************************
States With the Highest Number of COVID-19 Cases
Thomas C. Frohlich
April 15, 2020 4:05 pm
Last Updated: April 22, 2020 1:44 pm
More than 825,000 people in the United States have tested positive for COVID-19 as of Wednesday April 22, by far the most confirmed cases of any country in the world. The disease, caused by the novel coronavirus SARS-CoV-2, has infected at least 2.4 million people in nearly every country on Earth.
The World Health Organization releases daily statistics on countries and territories in its coronavirus disease (COVID-2019) situation reports. According to Tuesday's report, there are 2,311 cases per 1 million people and 110 deaths per 1 million people in the U.S. -- the 10th most and 13th most in the world.
Modeling by epidemiologists suggests that if nothing is done to combat the spread of the virus, up to 80% of Americans could contract COVID-19. (Here's a look at what countries are doing to flatten the curve).
Within the United States, the virus has spread rapidly amid testing and protective equipment shortfalls. So far, 4,159,321 tests have been administered in the US, or about 13 for every 1,000 people nationwide. As states anticipate increased need for hospital beds, masks, ventilators, and other equipment, governors are competing with one another to purchase supplies. (Here are the states where the virus is spreading the fastest right now.)
To determine the states with the highest number of COVID-19 cases per capita, 24/7 Wall St. reviewed data on confirmed COVID-19 cases and deaths as reported by local and state government health agencies. We calculated the confirmed cases and deaths for every 100,000 state residents using one-year population data from the U.S. Census Bureau’s 2018 American Community Survey.
The number of cases per capita appears closely related to testing rates and population density, as well as how early a state was exposed to the virus. We included this information for every state.
The gallery below shows the states ranked by the number of COVID-19 cases per capita, ranked from lowest to highest.
Detailed Findings
The states testing larger shares of their populations are reporting higher confirmed cases per resident. Eight of the 10 states with the most COVID-19 cases are testing at higher rates than the U.S. average of 8.6 tests per 1,000 people. North Dakota, Alaska, and Hawaii are notable exceptions as states with both low COVID-19 cases per capita and relatively high testing rates of 13.7, 11.0, and 13.3 per 1,000 residents.
Population density appears to be a major factor in the spread of the virus. Eight of the nation’s most crowded states, including New Jersey with the nation-leading density of 1,021 people per square mile, are among the 10 states with the most confirmed COVID-19 cases. The states with the lowest cases per capita tend to be more sparsely populated.
Social distancing is considered the best available means to slow the spread of a disease. The Centers for Disease Control and Prevention recommends people maintain a distance of at least 6 feet from one another, not gather in groups, and stay out of crowded places.
In the study, “Social Distancing to Slow the U.S. COVID-19 Epidemic: an Interrupted Time-Series Analysis,” a preprint of non-peer reviewed study published by Harvard infectious disease experts on April 8, statewide social distancing measures were associated with a decrease in U.S. COVID-19 epidemic growth.
“Based on the size of the epidemic at the time of implementation in each state, social distancing measures were associated with a decrease of 3,090 cases at 7 days, and 68,255 cases at 14 days, after implementation.”
Methodology
To determine the states with the highest number of COVID-19 cases, 24/7 Wall St. reviewed data compiled and released by the New York Times on April 14 on total confirmed COVID-19 cases and deaths as of April 14, 2020 for all 50 states.
To compare states, we calculated the confirmed case and death counts for every 100,000 state residents using one-year data from the U.S. Census Bureau’s 2018 American Community Survey.
Data on the expected peak use of resources are based on projections for the need for hospital beds for COVID-19 patients from the Institute for Health Metrics and Evaluation of the University of Washington in Seattle. ICU beds are included in the count of hospital beds.
The percentage of each MSA’s population aged 65 and over came from The County Health Rankings & Roadmaps program, a collaboration between the Robert Wood Johnson Foundation and the University of Wisconsin Population Health Institute.
Testing data was obtained from The COVID Tracking Project, a volunteer-run repository of data related to the U.S. COVID-19 outbreak.
___________________________________________________________________________________________________________________
50. Minnesota
> COVID-19 confirmed cases as of 4/13/2020: 29.4 per 100,000 people (total: 1,650)
> Rank on April 7: 50
> COVID-19 related deaths as of 4/13/2020: 1.2 per 100,000 people — 13th lowest (total: 70)
> Total tests completed as of 4/13/2020: 6.7 per 1,000 people — 19th lowest (total: 37,454)
> Positive test rate as of 4/13/2020: 4.3% — 7th lowest
> Date of first case: March 6, 2020
> Population density: 64.5 per sq. mi. — 20th lowest
> Total population: 5,611,179
> COVID-19 confirmed cases as of 4/13/2020: 35.3 per 100,000 people (total: 638)
> Rank on April 7: 49
> COVID-19 related deaths as of 4/13/2020: 0.5 per 100,000 people — 2nd lowest (total: 9)
> Total tests completed as of 4/13/2020: 9.0 per 1,000 people — 19th highest (total: 16,302)
> Positive test rate as of 4/13/2020: 3.7% — 4th lowest
> Date of first case: March 17, 2020
> Population density: 74.5 per sq. mi. — 22nd lowest
> Total population: 1,805,83248. Hawaii
> COVID-19 confirmed cases as of 4/13/2020: 35.3 per 100,000 people (total: 502)
> Rank on April 7: 45
> COVID-19 related deaths as of 4/13/2020: 0.6 per 100,000 people — 4th lowest (total: 9)
> Total tests completed as of 4/13/2020: 13.3 per 1,000 people — 10th highest (total: 18,890)
> Positive test rate as of 4/13/2020: 2.6% — the lowest
> Date of first case: March 6, 2020
> Population density: 129.9 per sq. mi. — 20th highest
> Total population: 1,420,49147. Montana
> COVID-19 confirmed cases as of 4/13/2020: 37.1 per 100,000 people (total: 394)
> Rank on April 7: 43
> COVID-19 related deaths as of 4/13/2020: 0.7 per 100,000 people — 5th lowest (total: 7)
> Total tests completed as of 4/13/2020: 8.4 per 1,000 people — 23rd highest (total: 8,960)
> Positive test rate as of 4/13/2020: 4.3% — 6th lowest
> Date of first case: March 13, 2020
> Population density: 7.2 per sq. mi. — 3rd lowest
> Total population: 1,062,30546. Alaska
> COVID-19 confirmed cases as of 4/13/2020: 37.3 per 100,000 people (total: 275)
> Rank on April 7: 46
> COVID-19 related deaths as of 4/13/2020: 0.8 per 100,000 people — 7th lowest (total: 6)
> Total tests completed as of 4/13/2020: 11.0 per 1,000 people — 14th highest (total: 8,087)
> Positive test rate as of 4/13/2020: 3.4% — 3rd lowest
> Date of first case: March 12, 2020
> Population density: 1.1 per sq. mi. — the lowest
> Total population: 737,43845. Oregon
> COVID-19 confirmed cases as of 4/13/2020: 37.8 per 100,000 people (total: 1,584)
> Rank on April 7: 47
> COVID-19 related deaths as of 4/13/2020: 1.3 per 100,000 people — 14th lowest (total: 53)
> Total tests completed as of 4/13/2020: 7.1 per 1,000 people — 21st lowest (total: 29,793)
> Positive test rate as of 4/13/2020: 5.1% — 9th lowest
> Date of first case: Feb. 28, 2020
> Population density: 42.6 per sq. mi. — 13th lowest
> Total population: 4,190,713
44. North Dakota
> COVID-19 confirmed cases as of 4/13/2020: 43.5 per 100,000 people (total: 331)
> Rank on April 7: 40
> COVID-19 related deaths as of 4/13/2020: 1.2 per 100,000 people — 12th lowest (total: 9)
> Total tests completed as of 4/13/2020: 13.7 per 1,000 people — 9th highest (total: 10,398)
> Positive test rate as of 4/13/2020: 3.0% — 2nd lowest
> Date of first case: March 11, 2020
> Population density: 10.8 per sq. mi. — 4th lowest
> Total population: 760,077
> COVID-19 confirmed cases as of 4/13/2020: 45.1 per 100,000 people (total: 871)
> Rank on April 7: 48
> COVID-19 related deaths as of 4/13/2020: 1.0 per 100,000 people — 9th lowest (total: 19)
> Total tests completed as of 4/13/2020: 5.7 per 1,000 people — 10th lowest (total: 11,013)
> Positive test rate as of 4/13/2020: 7.4% — 14th lowest
> Date of first case: Feb. 17, 2020
> Population density: 24.9 per sq. mi. — 8th lowest
> Total population: 1,929,268
42. Kentucky
> COVID-19 confirmed cases as of 4/13/2020: 45.8 per 100,000 people (total: 2,048)
> Rank on April 7: 44
> COVID-19 related deaths as of 4/13/2020: 2.4 per 100,000 people — 21st highest (total: 106)
> Total tests completed as of 4/13/2020: 5.8 per 1,000 people — 12th lowest (total: 25,897)
> Positive test rate as of 4/13/2020: 7.6% — 16th lowest
> Date of first case: March 6, 2020
> Population density: 110.6 per sq. mi. — 21st highest
> Total population: 4,468,402
41. North Carolina
> COVID-19 confirmed cases as of 4/13/2020: 46.4 per 100,000 people (total: 4,815)
> Rank on April 7: 42
> COVID-19 related deaths as of 4/13/2020: 0.9 per 100,000 people — 8th lowest (total: 91)
> Total tests completed as of 4/13/2020: 6.0 per 1,000 people — 14th lowest (total: 62,159)
> Positive test rate as of 4/13/2020: 7.3% — 13th lowest
> Date of first case: March 3, 2020
> Population density: 192.9 per sq. mi. — 14th highest
> Total population: 10,383,620
40. Kansas
> COVID-19 confirmed cases as of 4/13/2020: 47.5 per 100,000 people (total: 1,383)
> Rank on April 7: 41
> COVID-19 related deaths as of 4/13/2020: 2.2 per 100,000 people — 25th highest (total: 63)
> Total tests completed as of 4/13/2020: 4.6 per 1,000 people — 3rd lowest (total: 13,290)
> Positive test rate as of 4/13/2020: 10.1% — 25th highest
> Date of first case: March 7, 2020
> Population density: 35.4 per sq. mi. — 10th lowest
> Total population: 2,911,510
> COVID-19 confirmed cases as of 4/13/2020: 47.6 per 100,000 people (total: 275)
> Rank on April 7: 32
> COVID-19 related deaths as of 4/13/2020: 0.2 per 100,000 people — the lowest (total: 1)
> Total tests completed as of 4/13/2020: 9.7 per 1,000 people — 18th highest (total: 5,621)
> Positive test rate as of 4/13/2020: 4.8% — 8th lowest
> Date of first case: March 11, 2020
> Population density: 5.9 per sq. mi. — 2nd lowest
> Total population: 577,73738. Arkansas
> COVID-19 confirmed cases as of 4/13/2020: 48.9 per 100,000 people (total: 1,475)
> Rank on April 7: 38
> COVID-19 related deaths as of 4/13/2020: 1.0 per 100,000 people — 10th lowest (total: 30)
> Total tests completed as of 4/13/2020: 6.6 per 1,000 people — 18th lowest (total: 19,760)
> Positive test rate as of 4/13/2020: 6.5% — 11th lowest
> Date of first case: March 11, 2020
> Population density: 56.7 per sq. mi. — 17th lowest
> Total population: 3,013,825
37. Texas
> COVID-19 confirmed cases as of 4/13/2020: 50.5 per 100,000 people (total: 14,488)
> Rank on April 7: 39
> COVID-19 related deaths as of 4/13/2020: 1.1 per 100,000 people — 11th lowest (total: 320)
> Total tests completed as of 4/13/2020: 4.3 per 1,000 people — the lowest (total: 124,543)
> Positive test rate as of 4/13/2020: 10.8% — 21st highest
> Date of first case: Feb. 12, 2020
> Population density: 106.9 per sq. mi. — 22nd highest
> Total population: 28,701,845
36. Arizona
> COVID-19 confirmed cases as of 4/13/2020: 51.6 per 100,000 people (total: 3,702)
> Rank on April 7: 36
> COVID-19 related deaths as of 4/13/2020: 1.7 per 100,000 people — 20th lowest (total: 122)
> Total tests completed as of 4/13/2020: 5.9 per 1,000 people — 13th lowest (total: 42,132)
> Positive test rate as of 4/13/2020: 8.4% — 17th lowest
> Date of first case: January 26, 2020
> Population density: 62.9 per sq. mi. — 19th lowest
> Total population: 7,171,646
35. Maine
> COVID-19 confirmed cases as of 4/13/2020: 52.2 per 100,000 people (total: 698)
> Rank on April 7: 31
> COVID-19 related deaths as of 4/13/2020: 1.4 per 100,000 people — 16th lowest (total: 19)
> Total tests completed as of 4/13/2020: 5.1 per 1,000 people — 6th lowest (total: 6,765)
> Positive test rate as of 4/13/2020: 9.4% — 24th lowest
> Date of first case: March 12, 2020
> Population density: 37.8 per sq. mi. — 12th lowest
> Total population: 1,338,404
34. Oklahoma
> COVID-19 confirmed cases as of 4/13/2020: 52.5 per 100,000 people (total: 2,069)
> Rank on April 7: 34
> COVID-19 related deaths as of 4/13/2020: 2.5 per 100,000 people — 20th highest (total: 98)
> Total tests completed as of 4/13/2020: 5.8 per 1,000 people — 11th lowest (total: 22,790)
> Positive test rate as of 4/13/2020: 8.6% — 20th lowest
> Date of first case: March 6, 2020
> Population density: 56.4 per sq. mi. — 16th lowest
> Total population: 3,943,079
33. Iowa
> COVID-19 confirmed cases as of 4/13/2020: 54.2 per 100,000 people (total: 1,710)
> Rank on April 7: 37
> COVID-19 related deaths as of 4/13/2020: 1.4 per 100,000 people — 15th lowest (total: 44)
> Total tests completed as of 4/13/2020: 5.6 per 1,000 people — 9th lowest (total: 17,626)
> Positive test rate as of 4/13/2020: 9.0% — 22nd lowest
> Date of first case: March 8, 2020
> Population density: 56.1 per sq. mi. — 15th lowest
> Total population: 3,156,145
32. Wisconsin
> COVID-19 confirmed cases as of 4/13/2020: 59.0 per 100,000 people (total: 3,428)
> Rank on April 7: 27
> COVID-19 related deaths as of 4/13/2020: 2.7 per 100,000 people — 19th highest (total: 155)
> Total tests completed as of 4/13/2020: 6.8 per 1,000 people — 20th lowest (total: 39,281)
> Positive test rate as of 4/13/2020: 8.5% — 19th lowest
> Date of first case: Feb. 5, 2020
> Population density: 88.8 per sq. mi. — 24th lowest
> Total population: 5,813,568
> COVID-19 confirmed cases as of 4/13/2020: 59.7 per 100,000 people (total: 6,975)
> Rank on April 7: 29
> COVID-19 related deaths as of 4/13/2020: 2.3 per 100,000 people — 22nd highest (total: 274)
> Total tests completed as of 4/13/2020: 5.4 per 1,000 people — 8th lowest (total: 63,260)
> Positive test rate as of 4/13/2020: 10.4% — 24th highest
> Date of first case: March 9, 2020
> Population density: 260.8 per sq. mi. — 10th highest
> Total population: 11,689,442
30. California
> COVID-19 confirmed cases as of 4/13/2020: 61.5 per 100,000 people (total: 24,334)
> Rank on April 7: 28
> COVID-19 related deaths as of 4/13/2020: 1.8 per 100,000 people — 23rd lowest (total: 725)
> Total tests completed as of 4/13/2020: 4.8 per 1,000 people — 4th lowest (total: 190,334)
> Positive test rate as of 4/13/2020: 11.5% — 19th highest
> Date of first case: January 25, 2020
> Population density: 241.7 per sq. mi. — 11th highest
> Total population: 39,557,045
29. New Mexico
> COVID-19 confirmed cases as of 4/13/2020: 64.2 per 100,000 people (total: 1,345)
> Rank on April 7: 33
> COVID-19 related deaths as of 4/13/2020: 1.5 per 100,000 people — 17th lowest (total: 31)
> Total tests completed as of 4/13/2020: 14.6 per 1,000 people — 6th highest (total: 30,554)
> Positive test rate as of 4/13/2020: 4.1% — 5th lowest
> Date of first case: March 11, 2020
> Population density: 17.2 per sq. mi. — 6th lowest
> Total population: 2,095,428
28. Virginia
> COVID-19 confirmed cases as of 4/13/2020: 67.5 per 100,000 people (total: 5,747)
> Rank on April 7: 30
> COVID-19 related deaths as of 4/13/2020: 1.7 per 100,000 people — 22nd lowest (total: 149)
> Total tests completed as of 4/13/2020: 4.9 per 1,000 people — 5th lowest (total: 41,419)
> Positive test rate as of 4/13/2020: 13.9% — 14th highest
> Date of first case: March 7, 2020
> Population density: 199.1 per sq. mi. — 13th highest
> Total population: 8,517,685
> COVID-19 confirmed cases as of 4/13/2020: 67.6 per 100,000 people (total: 3,439)
> Rank on April 7: 25
> COVID-19 related deaths as of 4/13/2020: 1.7 per 100,000 people — 21st lowest (total: 87)
> Total tests completed as of 4/13/2020: 6.2 per 1,000 people — 15th lowest (total: 31,450)
> Positive test rate as of 4/13/2020: 10.6% — 23rd highest
> Date of first case: March 6, 2020
> Population density: 158.8 per sq. mi. — 18th highest
> Total population: 5,084,127
26. Missouri
> COVID-19 confirmed cases as of 4/13/2020: 71.6 per 100,000 people (total: 4,388)
> Rank on April 7: 24
> COVID-19 related deaths as of 4/13/2020: 2.2 per 100,000 people — 24th highest (total: 137)
> Total tests completed as of 4/13/2020: 7.4 per 1,000 people — 23rd lowest (total: 45,221)
> Positive test rate as of 4/13/2020: 9.2% — 23rd lowest
> Date of first case: March 7, 2020
> Population density: 87.9 per sq. mi. — 23rd lowest
> Total population: 6,126,452
25. Utah
> COVID-19 confirmed cases as of 4/13/2020: 74.8 per 100,000 people (total: 2,363)
> Rank on April 7: 22
> COVID-19 related deaths as of 4/13/2020: 0.6 per 100,000 people — 3rd lowest (total: 18)
> Total tests completed as of 4/13/2020: 14.0 per 1,000 people — 8th highest (total: 44,263)
> Positive test rate as of 4/13/2020: 5.2% — 10th lowest
> Date of first case: Feb. 25, 2020
> Population density: 37.2 per sq. mi. — 11th lowest
> Total population: 3,161,105
> COVID-19 confirmed cases as of 4/13/2020: 75.2 per 100,000 people (total: 1,020)
> Rank on April 7: 23
> COVID-19 related deaths as of 4/13/2020: 1.7 per 100,000 people — 19th lowest (total: 23)
> Total tests completed as of 4/13/2020: 8.3 per 1,000 people — 24th highest (total: 11,247)
> Positive test rate as of 4/13/2020: 8.8% — 21st lowest
> Date of first case: March 2, 2020
> Population density: 145.1 per sq. mi. — 19th highest
> Total population: 1,356,458
23. Alabama
> COVID-19 confirmed cases as of 4/13/2020: 77.8 per 100,000 people (total: 3,805)
> Rank on April 7: 26
> COVID-19 related deaths as of 4/13/2020: 2.1 per 100,000 people — 25th lowest (total: 104)
> Total tests completed as of 4/13/2020: 4.4 per 1,000 people — 2nd lowest (total: 21,691)
> Positive test rate as of 4/13/2020: 16.6% — 13th highest
> Date of first case: March 13, 2020
> Population density: 93.2 per sq. mi. — 25th highest
> Total population: 4,887,871
22. Tennessee
> COVID-19 confirmed cases as of 4/13/2020: 81.0 per 100,000 people (total: 5,483)
> Rank on April 7: 21
> COVID-19 related deaths as of 4/13/2020: 1.7 per 100,000 people — 18th lowest (total: 114)
> Total tests completed as of 4/13/2020: 10.4 per 1,000 people — 15th highest (total: 70,696)
> Positive test rate as of 4/13/2020: 7.5% — 15th lowest
> Date of first case: March 5, 2020
> Population density: 160.6 per sq. mi. — 17th highest
> Total population: 6,770,010
> COVID-19 confirmed cases as of 4/13/2020: 82.8 per 100,000 people (total: 1,453)
> Rank on April 7: 19
> COVID-19 related deaths as of 4/13/2020: 1.9 per 100,000 people — 24th lowest (total: 33)
> Total tests completed as of 4/13/2020: 8.5 per 1,000 people — 22nd highest (total: 14,917)
> Positive test rate as of 4/13/2020: 9.6% — 25th lowest
> Date of first case: March 13, 2020
> Population density: 21.0 per sq. mi. — 7th lowest
> Total population
20. South Dakota
> COVID-19 confirmed cases as of 4/13/2020: 98.4 per 100,000 people (total: 868)
> Rank on April 7: 35
> COVID-19 related deaths as of 4/13/2020: 0.7 per 100,000 people — 6th lowest (total: 6)
> Total tests completed as of 4/13/2020: 9.7 per 1,000 people — 17th highest (total: 8,596)
> Positive test rate as of 4/13/2020: 8.5% — 18th lowest
> Date of first case: March 10, 2020
> Population density: 11.4 per sq. mi. — 5th lowest
> Total population: 882,235
> COVID-19 confirmed cases as of 4/13/2020: 98.5 per 100,000 people (total: 2,942)
> Rank on April 7: 20
> COVID-19 related deaths as of 4/13/2020: 3.3 per 100,000 people — 18th highest (total: 98)
> Total tests completed as of 4/13/2020: 7.2 per 1,000 people — 22nd lowest (total: 21,440)
> Positive test rate as of 4/13/2020: 13.0% — 17th highest
> Date of first case: March 11, 2020
> Population density: 61.7 per sq. mi. — 18th lowest
> Total population: 2,986,53018. Florida
> COVID-19 confirmed cases as of 4/13/2020: 98.6 per 100,000 people (total: 21,011)
> Rank on April 7: 18
> COVID-19 related deaths as of 4/13/2020: 2.3 per 100,000 people — 23rd highest (total: 498)
> Total tests completed as of 4/13/2020: 8.7 per 1,000 people — 20th highest (total: 184,935)
> Positive test rate as of 4/13/2020: 10.8% — 22nd highest
> Date of first case: March 1, 2020
> Population density: 323.9 per sq. mi. — 8th highest
> Total population: 21,299,325
17. Nevada
> COVID-19 confirmed cases as of 4/13/2020: 100.1 per 100,000 people (total: 3,036)
> Rank on April 7: 17
> COVID-19 related deaths as of 4/13/2020: 3.8 per 100,000 people — 17th highest (total: 114)
> Total tests completed as of 4/13/2020: 8.1 per 1,000 people — 25th highest (total: 24,637)
> Positive test rate as of 4/13/2020: 11.5% — 18th highest
> Date of first case: March 5, 2020
> Population density: 27.4 per sq. mi. — 9th lowest
> Total population: 3,034,392
16. Vermont
> COVID-19 confirmed cases as of 4/13/2020: 119.4 per 100,000 people (total: 748)
> Rank on April 7: 13
> COVID-19 related deaths as of 4/13/2020: 4.5 per 100,000 people — 13th highest (total: 28)
> Total tests completed as of 4/13/2020: 16.6 per 1,000 people — 5th highest (total: 10,407)
> Positive test rate as of 4/13/2020: 7.2% — 12th lowest
> Date of first case: March 7, 2020
> Population density: 65.1 per sq. mi. — 21st lowest
> Total population: 626,299
15. Indiana
> COVID-19 confirmed cases as of 4/13/2020: 123.1 per 100,000 people (total: 8,236)
> Rank on April 7: 15
> COVID-19 related deaths as of 4/13/2020: 5.2 per 100,000 people — 11th highest (total: 350)
> Total tests completed as of 4/13/2020: 6.4 per 1,000 people — 16th lowest (total: 42,504)
> Positive test rate as of 4/13/2020: 18.7% — 10th highest
> Date of first case: March 6, 2020
> Population density: 183.7 per sq. mi. — 15th highest
> Total population: 6,691,878
14. Georgia
> COVID-19 confirmed cases as of 4/13/2020: 124.8 per 100,000 people (total: 13,125)
> Rank on April 7: 14
> COVID-19 related deaths as of 4/13/2020: 4.6 per 100,000 people — 12th highest (total: 479)
> Total tests completed as of 4/13/2020: 5.2 per 1,000 people — 7th lowest (total: 54,562)
> Positive test rate as of 4/13/2020: 23.0% — 5th highest
> Date of first case: March 2, 2020
> Population density: 177.0 per sq. mi. — 16th highest
> Total population: 10,519,475
> COVID-19 confirmed cases as of 4/13/2020: 135.0 per 100,000 people (total: 7,691)
> Rank on April 7: 12
> COVID-19 related deaths as of 4/13/2020: 5.4 per 100,000 people — 10th highest (total: 308)
> Total tests completed as of 4/13/2020: 6.5 per 1,000 people — 17th lowest (total: 37,169)
> Positive test rate as of 4/13/2020: 19.6% — 9th highest
> Date of first case: March 5, 2020
> Population density: 54.7 per sq. mi. — 14th lowest
> Total population: 5,695,564
12. Washington
> COVID-19 confirmed cases as of 4/13/2020: 139.8 per 100,000 people (total: 10,538)
> Rank on April 7: 8
> COVID-19 related deaths as of 4/13/2020: 7.0 per 100,000 people — 7th highest (total: 525)
> Total tests completed as of 4/13/2020: 12.4 per 1,000 people — 11th highest (total: 93,815)
> Positive test rate as of 4/13/2020: 11.1% — 20th highest
> Date of first case: January 21, 2020
> Population density: 105.7 per sq. mi. — 23rd highest
> Total population: 7,535,591
11. Maryland
> COVID-19 confirmed cases as of 4/13/2020: 147.9 per 100,000 people (total: 8,936)
> Rank on April 7: 16
> COVID-19 related deaths as of 4/13/2020: 4.3 per 100,000 people — 15th highest (total: 262)
> Total tests completed as of 4/13/2020: 8.6 per 1,000 people — 21st highest (total: 51,765)
> Positive test rate as of 4/13/2020: 17.3% — 12th highest
> Date of first case: March 5, 2020
> Population density: 487.1 per sq. mi. — 5th highest
> Total population: 6,042,718
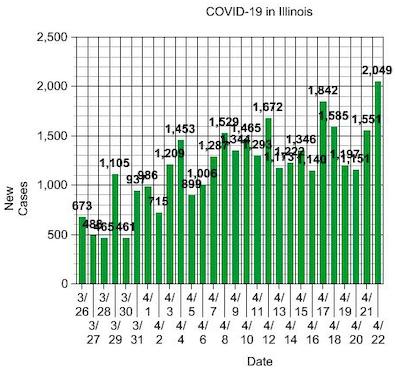
10. Illinois
> COVID-19 confirmed cases as of 4/13/2020: 172.9 per 100,000 people (total: 22,025)
> Rank on April 7: 10
> COVID-19 related deaths as of 4/13/2020: 6.3 per 100,000 people — 9th highest (total: 800)
> Total tests completed as of 4/13/2020: 7.9 per 1,000 people — 24th lowest (total: 100,742)
> Positive test rate as of 4/13/2020: 20.7% — 7th highest
> Date of first case: January 24, 2020
> Population density: 220.0 per sq. mi. — 12th highest
> Total population: 12,741,080
9. Delaware
> COVID-19 confirmed cases as of 4/13/2020: 182.1 per 100,000 people (total: 1,761)
> Rank on April 7: 11
> COVID-19 related deaths as of 4/13/2020: 4.2 per 100,000 people — 16th highest (total: 41)
> Total tests completed as of 4/13/2020: 12.3 per 1,000 people — 12th highest (total: 11,852)
> Positive test rate as of 4/13/2020: 13.7% — 15th highest
> Date of first case: March 11, 2020
> Population density: 388.6 per sq. mi. — 6th highest
> Total population: 967,171
> COVID-19 confirmed cases as of 4/13/2020: 189.7 per 100,000 people (total: 24,295)
> Rank on April 7: 9
> COVID-19 related deaths as of 4/13/2020: 4.4 per 100,000 people — 14th highest (total: 563)
> Total tests completed as of 4/13/2020: 9.8 per 1,000 people — 16th highest (total: 124,895)
> Positive test rate as of 4/13/2020: 18.3% — 11th highest
> Date of first case: March 6, 2020
> Population density: 278.1 per sq. mi. — 9th highest
> Total population: 12,807,060
7. Michigan
> COVID-19 confirmed cases as of 4/13/2020: 255.0 per 100,000 people (total: 25,487)
> Rank on April 7: 6
> COVID-19 related deaths as of 4/13/2020: 16.0 per 100,000 people — 5th highest (total: 1,601)
> Total tests completed as of 4/13/2020: 7.9 per 1,000 people — 25th lowest (total: 79,441)
> Positive test rate as of 4/13/2020: 31.0% — 3rd highest
> Date of first case: March 10, 2020
> Population density: 103.4 per sq. mi. — 24th highest
> Total population: 9,995,915
> COVID-19 confirmed cases as of 4/13/2020: 281.5 per 100,000 people (total: 2,976)
> Rank on April 7: 7
> COVID-19 related deaths as of 4/13/2020: 6.9 per 100,000 people — 8th highest (total: 73)
> Total tests completed as of 4/13/2020: 19.3 per 1,000 people — 3rd highest (total: 20,378)
> Positive test rate as of 4/13/2020: 13.1% — 16th highest
> Date of first case: March 1, 2020
> Population density: 684.3 per sq. mi. — 2nd highest
> Total population: 1,057,3155. Connecticut
> COVID-19 confirmed cases as of 4/13/2020: 374.5 per 100,000 people (total: 13,381)
> Rank on April 7: 5
> COVID-19 related deaths as of 4/13/2020: 16.9 per 100,000 people — 4th highest (total: 602)
> Total tests completed as of 4/13/2020: 11.5 per 1,000 people — 13th highest (total: 41,232)
> Positive test rate as of 4/13/2020: 29.2% — 4th highest
> Date of first case: March 8, 2020
> Population density: 644.5 per sq. mi. — 4th highest
> Total population: 3,572,665
4. Massachusetts
> COVID-19 confirmed cases as of 4/13/2020: 389.3 per 100,000 people (total: 26,867)
> Rank on April 7: 4
> COVID-19 related deaths as of 4/13/2020: 12.2 per 100,000 people — 6th highest (total: 844)
> Total tests completed as of 4/13/2020: 16.9 per 1,000 people — 4th highest (total: 116,733)
> Positive test rate as of 4/13/2020: 21.8% — 6th highest
> Date of first case: Feb. 1, 2020
> Population density: 654.0 per sq. mi. — 3rd highest
> Total population: 6,902,149
3. Louisiana
> COVID-19 confirmed cases as of 4/13/2020: 451.0 per 100,000 people (total: 21,016)
> Rank on April 7: 3
> COVID-19 related deaths as of 4/13/2020: 19.0 per 100,000 people — 3rd highest (total: 884)
> Total tests completed as of 4/13/2020: 22.3 per 1,000 people — 2nd highest (total: 104,053)
> Positive test rate as of 4/13/2020: 19.8% — 8th highest
> Date of first case: March 9, 2020
> Population density: 89.0 per sq. mi. — 25th lowest
> Total population: 4,659,978
2. New Jersey
> COVID-19 confirmed cases as of 4/13/2020: 725.0 per 100,000 people (total: 64,584)
> Rank on April 7: 2
> COVID-19 related deaths as of 4/13/2020: 27.4 per 100,000 people — 2nd highest (total: 2,443)
> Total tests completed as of 4/13/2020: 14.2 per 1,000 people — 7th highest (total: 126,737)
> Positive test rate as of 4/13/2020: 48.8% — the highest
> Date of first case: March 4, 2020
> Population density: 1021.3 per sq. mi. — the highest
> Total population: 8,908,520
1. New York
> COVID-19 confirmed cases as of 4/13/2020: 998.0 per 100,000 people (total: 195,031)
> Rank on April 7: 1
> COVID-19 related deaths as of 4/13/2020: 51.5 per 100,000 people — the highest (total: 10,056)
> Total tests completed as of 4/13/2020: 23.6 per 1,000 people — the highest (total: 461,602)
> Positive test rate as of 4/13/2020: 40.9% — 2nd highest
> Date of first case: March 1, 2020
> Population density: 358.2 per sq. mi. — 7th highest
> Total population: 19,542,209