 Sheila Bair 4 hours ago
Vulnerability in America’s lower income brackets poses a risk to the economy

Sheila Bair, former chair of the FDIC, will appear at Yahoo Finance’s All Markets Summit on Sept. 20.
There are lies, damn lies, and then there are statistics. This famous saying popularized by American humorist Mark Twain aptly describes the current use of economic statistics to paint an overly rosy picture of our economic health.
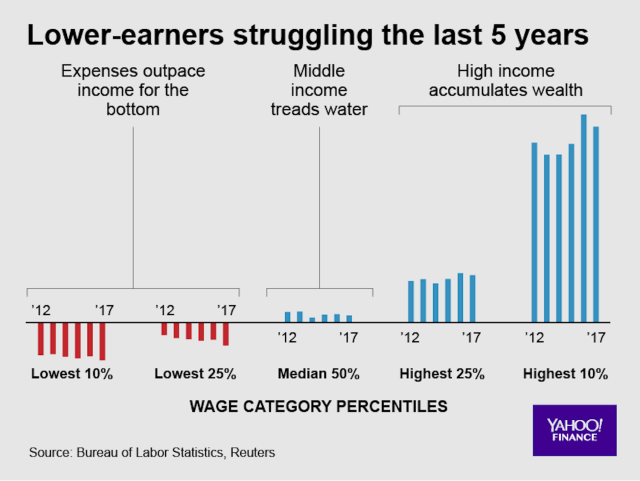
Too often, we rely on aggregate numbers or averages which camouflage the uneven distribution of economic progress (or lack thereof) among lower income families. For instance, the use of aggregates in calculating GDP masks the fact that those economic gains remain heavily skewed toward the rich. Similarly, the use of averages in reporting wage gains conceals distortions caused by booming wages among higher paid workers and the fact that by traditional measures, hourly real wages for most middle-class workers have slightly declined.
This same type of distortion was at work in some recent Wall Street analysis of statistics released by the New York Fed on household borrowing. The NY Fed reported that household borrowing had hit a new peak of $13.29 trillion in the second quarter of 2018, far surpassing its peak of $12.68 trillion in the frothy years preceding the financial crisis. Some analysts argued that this was actually good news because while household borrowing was up, so was consumers’ disposable (after-tax) income, which hit $15.46 trillion in the second quarter.
This put the debt-to-income ratio (DTI) at 86%, significantly lower than its all-time high of 116% in 2008 at the peak of the housing bubble. Thus, American households were financially healthy and had plenty of room to borrow even more, or so the argument went.
Lower-income groups have more trouble paying off debt
It is true that household debt in nominal dollars doesn’t tell you whether American households are over-extended without comparing that debt to the income available to repay it. However, to use the go-go years leading up to the crisis as the benchmark for sustainable rates of household borrowing is questionable, to say the least. In fact, household DTI’s were substantially lower than today’s levels throughout the post-war years. It wasn’t until the early 2000s that they started to escalate with the subprime lending craze. So by historical norms, even at 86%, household DTIs are quite high.
More importantly, aggregate debt-to-income ratios tell us little about the affordability of that debt among various income levels. Rich people may be borrowing a lot but then, they can afford it. Lower income households living near subsistence have scant capacity to absorb any debt. Unfortunately, detailed data about household borrowing among income groups is notoriously difficult to obtain.
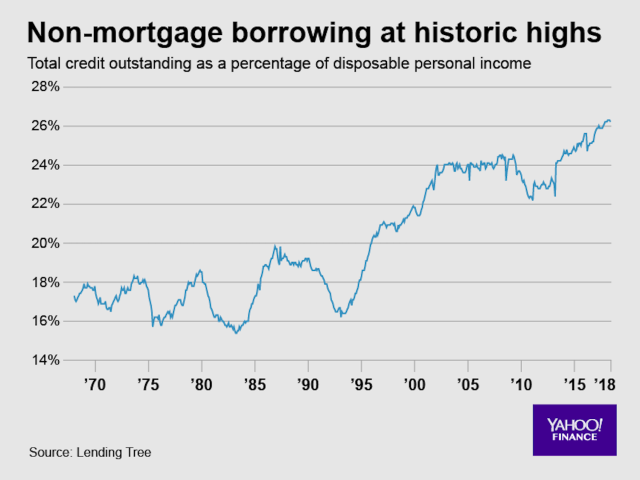
The New York Fed does provide some data on household debt growth rates by income level. This data show that non-mortgage household borrowing (primarily credit cards, auto, and student loans) has grown significantly over the past 5 years among lower income families, while mortgage loans have declined. Mortgage lending standards have tightened since the crisis, but now those families may be getting in over their heads with non-mortgage borrowing. Indeed, non-mortgage debt has grown by a whopping 38% over the past 5 years and its ratio to disposable income is even higher than during the pre-crisis years.
Another statistic Wall Street analysts have cited to argue that American households are not over-borrowing is the sharp increase in household net-worth relative to income, a common measure of balance sheet health. However, here again, to get an accurate picture, you must get behind aggregate numbers and look at the distribution of wealth by income level.
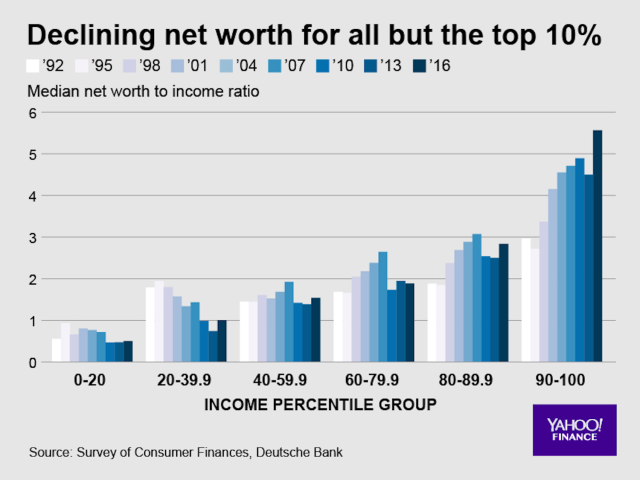
A more sophisticated analysis by Deutsche Bank found that net-worth to income ratios are distorted by rich households who have benefited mightily from appreciating home prices and an exuberant stock market. Net-worth to income ratios have actually fallen for households at all income levels except for the top 10%. The Deutsche analysis also found that “leverage”— the ratio of a family’s debt to its assets — had increased significantly for households in the bottom 40% of income, while decreasing for families in the upper income tiers. Given the massive loss of home ownership following the crisis among low- and middle-income families and their lack of equity ownership, they now have little in the way of assets to buffer them against financial stress. These lower income families are more fragile than ever, suffering from increased debt, stagnant or declining wages, and lack of assets.
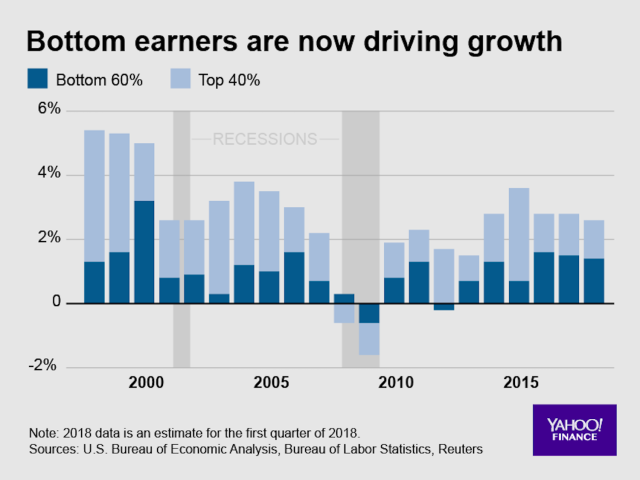
While noting these troubling trends among lower income families, Deutsche analysts concluded that they would not pose a threat to consumer spending as wealthier households represent a greater share of total consumption. However, a recent Reuters analysis reached a different conclusion, finding that spending by the bottom 60% of earners has accounted for most of the rise in consumer spending over the past two years. This breaks a decades-old trend of upper income households accounting for the lion’s share of consumer spending and portends trouble for the economy, as consumer spending accounts for over two-thirds of GDP growth. Reuters also found that spending increases among lower income households far outpaced their meager wage gains and that given their scant savings, they were presumably funding much of this increased consumption with debt.
The financial resilience of our lower income households matters to the health of our overall economy. It also matters to our financial stability. Rapid growth in consumer debt, particularly among economically distressed populations, can be a harbinger of recession and financial crisis. A growing body of research, led by the International Monetary Fund and others, shows that while high levels of consumer borrowing can provide short-term stimulus to an economy, in the long term, it will slow growth and risk financial crisis. As overburdened households are eventually forced to curb consumer spending to service their debt, the economy will slow and defaults will increase, leading banks to pull back on credit — severely if the banks themselves are over leveraged and lack the capacity to absorb credit losses. This is precisely the cycle we experienced in 2008.
Things are not as bad as they were during the subprime crisis — yet. But if we are to avoid repeating the mistakes of the past, we need to stop deluding ourselves with Twain’s damnable statistics. We need a clear-eyed understanding of the fragile financial condition of our most vulnerable households with better data and policies that would increase their disposable income. Regressive payroll taxes, high health care premiums, escalating education costs, poorly designed means testing of programs — all weigh on the purchasing power of working families and cry out for forceful policy responses.
We cannot keep trying to fulfill working families’ financial needs with more and more consumer borrowing. Economic growth sustained by broadly shared prosperity will be lasting. Growth supported by unaffordable debt will eventually collapse.
Sheila Bair is the former Chair of the FDIC and has held senior appointments in both Republican and Democrat Administrations. She currently serves as a board member or advisor to a several companies and is a founding board member of the Volcker Alliance, a nonprofit established to rebuild trust in government.
Above is from: https://www.yahoo.com/finance/news/vulnerability-americas-lower-income-brackets-poses-risk-economy-122920739.html