Friday, September 4, 2020

September 3: University of Washington COVID-19 Projections


Home

The September 3 death projections are through January1, 2021.

The August 6-27 projections are through December 1. 2020

The July 7-30 are through November 1, 2020.

The September 3 projections are available from:  https://covid19.healthdata.org/united-states-of-america

                         July 7----July 14-----JULY 22------July 30—August 6*—August 21*—August 27*—September 3

United States 208,255,  224,546, 219,864,  230,822,  295,011, 309,918; 317,312, NOW 410,451   Population 331.00 million  629.17 per million 678.39 per million, 664.24 per million, 697.35 per million, 891.17 per million, 936.3 per million, 958.65 per million; NOW 1240.03 per million


Georgia  3,857  deaths; 4736;  7336; 10,278, 11,288, 10.805, 12,410, NOW 13,871 Population 3.99 million   966.67 per million ; 1186 .97 per million;1838.60 per million; 2575.94 per million; 2829.07 per million; 2708.02 per million; 3110.28 per million; NOW 3476.44 per million

New York  32,221 deaths; 35,379; 35,039; 34,423;  33,945; 32,743,  33,960; NOW 41,653  Population 18.8 million  1713.88 per million; 1881.86 per million; 1863.78 per million; 1836.33 per million;  1805.59 per million; 1741.65 per million;1806.38 per million; NOW 2215.59 per million

Massachusetts  12,906 deaths; 10,121 deaths ; 9970;   9647;  10,314; 12.295, 12,410; NOW 14,175   Population 6.7 million  1926.27 per million 1510.60 per million; 1488.06 per million1439.85 per million; 1539.40 per million; 1835.07 per million;1852.24 per million; NOW 2115.67 per million

Louisiana   4,643 deaths; 5,167; 4955; 6401; 7901; 7840; 7993; NOW 8920  Population 4.6 million  1009.35  per million; 1123.26 per million; 1077.17 per million; 1391.52 per million;1717.61 per million; 1704.35 per million; 1737.61 per million; NOW 1939.13 per million

District of Columbia  666 deaths; 681 ; 694 ;  646; 605; 837;  935; NOW 1038 Population  .706 million  943.34 per million; 964.59 per million; 983.00 per million; 915.01 per million;  856.94 per million; 1185.55 per million; 1324.36 per million; NOW 1470.25 per million’

Illinois 8,907 deaths; 8,351;  8472 ;  8280;  9995; 11,071,15,058; NOW 18,068 Population 12.63 million  705.23 per million; 657.56 per million; 772.43 per million;  655.58 per million;  791.37 per million; 876.56 per million, 1192.24 per million; NOW 1430.56 per million

Connecticut  4,692  deaths; 4,456;  4750;  48445179; 4675; 4626; NOW 5060 deaths  Population  3.7 million   1268.11 per million; 1204.32 per million;1283.78 per million;  1309.19 per million; 1399.73 per million; 1263.52 per million; 1250.27 per million; NOW 1367.57 per million

South Carolina 242 deaths; 4,556; 3186;  3232; 3672; 4724; 5023; NOW 6764   Population 5.0 million  48.4 per million; 911.20 per million;  637.2 per million;646.4 per million; 734.40 per million; 944.8 per million; 1004.60 per million; NOW 1352.80 per million

Maryland  3,880 deaths ; 4,278;  4194;  4026; 5174;  5301; 4404; NOW 7997 Population 6.0 million  646.67  per million; 713.00 per million; 699.0 per million;  671.0 per million;  862.34 per million; 883.5 per million; 734 per million; NOW 1332.84 per million

Pennsylvania  9,999 deaths; 8,431; 8028;  8350; 8859; 14,998; 14,604;14,604; NOW 16,732   Population 12.7 million  787.32 per million; 663.86 per million; 632.13 per million;657.48 per million697.56 per million; 1180.94 per million; NOW 1317.48 per million

California 16,827 deaths;  21,264; 19,572;  16,515;  32,692; 41,110; 37,645; 49,602   Population 39.78 million  423.00 per million;  534.54 per million;492.01 per million;  415.16 per million; 821.82 per million; 1033.43 per million; 1497.52 per million;  NOW 1246.91 per million

Florida   17,477 deaths;19,285; 18,154,  16,318; 19,358; 21,174; 24,532; NOW 26,251   Population 21.47 million  814.01 per million; 893.23 per million; 845.55 per million; 760.04 per million; 901.63 per million986.21 per million;1142.63 per million; NOW 1222.68 per million

Iowa  841 deaths;  1,225; 1813,1700; 2163 2856; 3077; NOW 3863  Population 3.17 million  265.30 per million; 386.44 per million; 571.93 per million;  536.28 per million682.34 per million; 900.95 per million;  970.66 per million; NOW 1218.61 per million

Arizona  5,553 deaths; 5,177;  5664;79466840; 9562;  7148; NOW 8766   Population 7.29 million  761.73 per million ;710.15 per million;  776.95 per million: 1089.97 per million; 938.27 per million.; 1311.66 per million; 980.52 per million; NOW 1202.47 per million

Virginia 5,190 deaths ;  4,881;  2643; 2289;  5842; 2828; 2940; NOW 9780   Population 8.63 million  601.39  per million ;565.59 per million; 306.26 per million:  265.24 per million; 676.94 per million; 327.69 per million; 340.67 per million; NOW 1133.26 per million

Texas    13,450 deaths;18,675;  18,812; 24,557; 27,435; 25.532; 27,194; NOW 34,319    Population 29.90 million  449.83 per million; 624.58 per million; 629.16 per million; 921.30 per million; 917.56 per million; 853.91 per million; 909.50 per million; NOW 1147.79 per million

Arkansas 724 deaths;  617, 895; 833; 2234; 2364;  2406; NOW 3268    Population 3.018 million  239.89 per million 204.44 per million; 293.55 per million;   276.01 per million ; 740.23 per million; 783.30 per million; 797.22 per million; NOW 1082.84 per million

Ohio  5,712  deaths;4,545;  3900;  5694; 9041; 6046; 7564; NOW 11,975  Population 11.73 million  486.96 per million; 387.47 per million; 332.48 per million; 485.42 per million; 770.76 per million; 515.43 per million; 644.84 per million; NOW 1020.89 per million

Missouri  5436 deaths; 3068;  5231; NOW 5933 Population 6.137 million; 885.77 per million; 499.92 per million, 852.37 per million; NOW 966.76 per million

Oklahoma  587  deaths;1,029 ; 1533; 1484;   2967, 2058;  3055; NOW 3589 Population 4.0 million  146.75 per million 257.23 per million; 383.25 per million; 371.24 per million; 741.75 per million; 514.5 per million;  763.75 per million; NOW 897.25 per million

Kansas 632 deaths ; 410;  412; 588; 2245; 1277; 994; NOW 2453  Population  2.77 million  228.16 per million 148.01 per million; 148.74 per million;  212.27 per million;  810.47 per million; 461.01 per million;  358.84 per million; NOW 885.56 per million

North Dakota 215 deaths; 371; 491; NOW 618 Population .762 million 282.15 per million;486.88 per million; 644.36 per million; NOW 811.02 per million

Oregon  471 deaths; 605;  683;  634; 2967; 2408; 2395, NOW 3457    Population 4.3 million  109.53 per million 140.70 per million;  158.84 per million; 147.44 per million; 690.0 per million; 560.0 per million; 556.98 per million; NOW 803.95 per million

Wisconsin  1,410 deaths;  992; 1041; 2030; 3708 ;1775; 2340; NOW 4603 Population 5.82 million  242,27 per million 170.45 per million; 178.87 per million; 348.80 per million; 637.11 per million ; 304.98 per million; 402.06 per million; NOW 790.89 per million

Colorado  1937 deaths;  2,032; 2774:  2665; 5179; 2967;  2395; NOW 4417  Population 5.8 million  333.97 per million; 478.28 per million; NOW 459.48 per million; 892.93 per million’ 511.55 per million; 412.93 per million; NOW 761.55 per million

Washington  2,510 deaths; 3,170; 3303; 2178; 5078; 5040;  4410; NOW 5400  Population 7.17 million  325.98 per million ;442.112 per million; 450.67 per million;  303.77 per million; 708.23 per million; 702.93 per million;615.06 per million; NOW 753.14 per million

South Dakota 254 deaths; 281; 291; NOW 516  Population .885 million 287.01 per million;317.51 per million; 328.81 per million; NOW 583.05 per million

Idaho  120 deaths; 559; 513; 365;  916, 983: 1373; NOW 1641 Population 4.3 million  109.53 per million 140.70 per million;  158.84 per million;147.44 per million;  213.02 per million; 228.60 per million; 319.30 per million; NOW 381.63 per million

DEATHS
How many overall deaths will there be?

Our model is updated to account for new data and information, and the estimates may change as a result. For the latest estimate, visit our COVID-19 projections tool.

Why do your results show a wide range in the forecast for deaths?

Larger uncertainty intervals – or the range within which estimated deaths are likely to fall – can occur because of limited data availability, small studies, and conflicting data. A smaller range generally reflects extensive data availability, large studies, and data that are consistent across sources.

Why did the estimates for my location change?

To learn more, please visit our update page.

Why is the peak for daily deaths still forecast in the future when it looks like it has already occurred in my location?

The date of peak daily deaths depends on the model’s projections. If the model projects that the number of daily deaths will continue to rise, then the peak will be projected for a future date. It is important to note that the data on daily deaths may fluctuate dramatically due to irregularities in reporting. Health care workers are extremely busy caring for COVID-19 patients, so they may fall behind on reporting deaths. Once health care workers catch up on their reporting, however, it may appear as though there has been a spike in daily deaths.

Why are the “observed deaths” shown in your results for my location different from what is shown on the government’s official page?

For deaths, we primarily use the COVID-19 death data aggregated by the Johns Hopkins University (JHU) data repository (see "Where does IHME obtain its data?"). The JHU repository uses Coordinated Universal Time (UTC), which means new days start at 8 p.m. Eastern time. The JHU counts may differ slightly from local government data as a result of these timing differences. Also, the JHU repository is not necessarily synchronized to the update schedule of every location, so there may be a short lag that is reflected in a difference between our recorded daily deaths in a given location and those ultimately reported on government websites. Although this will be corrected when we update our analysis, in some cases, these differences may persist for several days.

Yet another reason why observed deaths may differ from numbers reported by governments is due to data processing. To address irregularities in the daily death data, we average data from the last three days to create a smooth version. To see the death data exactly as it is reported, 1) click the “Chart settings” icon in the upper right corner of the chart, and 2) turn off “Smoothed data.”

There are reports of deaths being under-reported in places. How does this impact your forecast?

We are learning that not all deaths due to COVID-19 that occur at home or in nursing homes have been attributed to COVID-19. As awareness increases, the number of reported deaths is growing, with some locations now reporting presumptive COVID-19 deaths. Another challenge is that COVID-19 death data fluctuate substantially each day, with some locations reporting more deaths on Tuesdays than on Sundays and Mondays. We believe this variation is due to data reporting practices instead of actual death patterns. To mitigate the impact of inconsistent reporting on our forecasts, our published predictions are based on averaging multiple iterations of projections. As new data emerges, we incorporate it into our model, and our projections will shift up or down in response to the data. To learn more, see our estimation updates.

For Ecuador and Peru in particular, the number of reported deaths due to COVID-19 appears to be improbably low. Instead of using reported COVID-19 deaths for these countries, we are approximating deaths from COVID-19. To approximate COVID-19 deaths, we used the number of excess deaths occurring in Ecuador and Peru during the COVID-19 pandemic and observations from other countries where we had weekly reports of total deaths and high-quality data on COVID-19 deaths.

******************************************************************************************************************************************************************************

Dire COVID-19 death toll projections from researchers Trump administration touted

Corky Siemaszko

,

NBC NewsSeptember 4, 2020

Dire COVID-19 death toll projections from researchers Trump administration touted

More

Nearly three million people will “most likely” die of COVID-19 worldwide by the end of the year if governments don’t tighten social distancing requirements and people aren’t more vigilant about wearing masks, a research outfit the Trump Administration once relied on is warning.

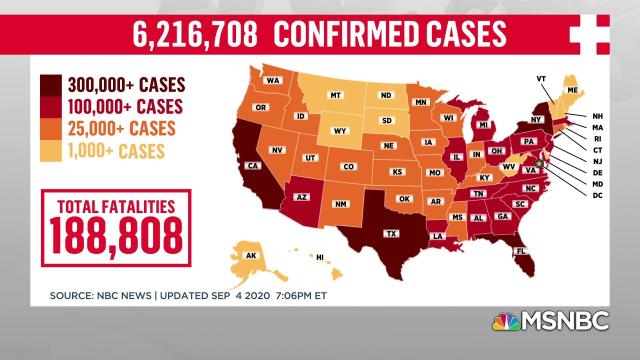
The death toll in the U.S., which is currently around 188,000, could more than double to over 400,000 by Jan. 1, the Institute for Health Metrics and Evaluation (IHME) at the University of Washington’s School of Medicine is forecasting.

And that’s not even the “worst case” scenario the IHME laid out in its sobering report. In that model, four million people would die worldwide and over 620,000 perish in the U.S. from COVID-19, the researchers concluded.

In the “best case” scenario, two million people will be dead across the globe by the end of the year and there will be anywhere from 257,286 to 327,775 COVID-19 fatalities in the U.S.

"The worst is yet to come," IHME Director Dr. Christopher Murray warned on a call with reporters Friday.

“We are facing the prospect of a deadly December, especially in Europe, Central Asia, and the United States,” Murray said in a statement released earlier. “But the science is clear and the evidence irrefutable: mask-wearing, social distancing, and limits to social gatherings are vital to helping prevent transmission of the virus.”


Different coronavirus landscape increases risk of post-Labor Day weekend spike

WE’RE NOT ONLY CLOSING IN ON


Partly funded by the Bill and Melinda Gates Foundation, the IHME was criticized in the early days of the pandemic for providing optimistic projections on the progress of the pandemic that President Donald Trump and his team touted as evidence the U.S. was getting COVID-19 under control — and which turned out to be wrong.

Right now, the “most likely” scenario is that 2.8 million people will die if “individual mask use and other mitigation measures remain unchanged,” Murray's team said.

In each of the IMHE models, the countries likeliest to lose the most people are India and the United States.

Currently, the United States has reported more than 188,000 deaths out of nearly 6.2 million confirmed cases, — both world-leading figures, the latest NBC News numbers show.

The U.S. now accounts for almost a quarter of the more than 26 million cases and about a fifth of the nearly 870,000 deaths worldwide, according to the Johns Hopkins University COVID-19 dashboard.

Brazil is next with 124,614 deaths followed by India, which has 68,472 on the dashboard.

Murray, in the IHME release, acknowledged that their scenarios represent “a significant increase over the current total deaths, estimated at nearly 910,000 worldwide.” But he said the pandemic is following “seasonal patterns similar to pneumonia which means countries in the northern hemisphere are likely to get socked again when the weather turns colder.

“People in the Northern Hemisphere must be especially vigilant as winter approaches, since the coronavirus, like pneumonia, will be more prevalent in cold climates,” Murray said.

In July, a top World Health Organization spokeswoman said the pandemic was not seasonal but rather "one big wave."

"This virus likes all weather," Dr. Margaret Harris said.

In other COVID-19 developments:

  • The U.S. economy added 1.4 million jobs last month and the unemployment rate fell to 8.4 percent — the first time it’s been below 10 percent since the beginning of the pandemic. “Great Jobs Numbers!” Trump boasted in a Tweet. Economists were far less impressed, NBC News reported. "We have had three huge months of job gains, but so far have regained less than half of the losses in March and April," said Dan North, senior economist at Euler Hermes North America. "Job gains so far have probably been the easy ones to get, where a business opened back up and brought back in its employees." Also, more layoffs are looming in hard-hit sectors like the airline industry, experts are warning.

  • The FBI and state investigators raided a Pennsylvania nursing home on Thursday where hundreds of residents and staff members tested positive for coronavirus and dozens have died. The Brighton Rehabilitation and Wellness Center. located northeast of Pittsburgh, had been flagged for dangerous conditions even before the pandemic, NBC News reported in April.

  • Florida has barred local health officials from releasing detailed information about new COVID-19 cases in public schools, the Orlando Sentinel reported. The newspaper discovered this while questioning the state health officer in Orange County about the "first potential case of student-to-teacher transmission“ "Because it’s confidential information, I can’t continue to release that data to the public in that format,” Dr. Raul Pino said. A spokesman for the Orange County public schools said they will continue releasing general pandemic information to the public. The schools recently reopened over the objections of teachers who say they're being forced to work in unsafe conditions, and as the state continues to rack up thousands of new cases every day. The Florida Department of Health has been accused of censoring the data to make the state’s numbers less awful and with ousting a whistleblower. The agency has denied the allegation.

  • Northeastern University in Boston gave 11 students 24 hours on Friday to pack up and leave for the rest of the semester after they were caught partying in a hotel room and violating the school's pandemic public health rules. Meanwhile, more colleges and universities were reporting new outbreaks. The University of Arizona reported its biggest new daily number of postive COVID-19 tests with 126 just on Thursday. Some 220 new positive cases were reported by the University of Nebraska this week. And over 1,000 students have tested positive for COVID-19 at Ohio State University, according to the school's official coronavirus dashboard.

September 4: 5368* New COVID-19 Cases in Illinois

*Caused in part because of backlog of tests.

Boone County one of 29 counties on warning level.

28 additional deaths in US.  4 new COVID-19 cases in Boone County.  Boone County positivity rate is now 8.1%.

**********************************************************************************************************************************************************************

Cleared data backlog leads to spike in Friday’s COVID-19 tests, cases

Cleared data backlog leads to spike in Friday’s COVID-19 tests, cases

The graph shows the number of COVID-19 tests completed each day (blue), next to the number of positive cases those tests yield (red), according to the Illinois Department of Public Health. The latest number reflects the clearing of a data backlog which suppressed testing numbers the days prior. (Credit: Jerry Nowicki of Capitol News Illinois)

Friday, September 4, 2020

More than 60K test results reported over last 4 days on average

By JERRY NOWICKI
Capitol News Illinois
jnowicki@capitolnewsillinois.com

SPRINGFIELD — New confirmed cases of COVID-19 and the number of tests results reported skyrocketed Friday, reflecting the clearing of a data backlog in the state’s public reporting of case counts.

The backlog lasted approximately two days and drove down test counts, apparently starting Tuesday, Sept. 1. After clearing the backlog by Friday, Illinois Department of Public Health reported 5,368 new cases among 149,273 test results recorded over 24 hours. That made for a 3.6 percent one-day positivity rate.

The number, taken by itself, represents a massive spike more than doubling the previous highest testing total and smashing the single-day confirmed case record by more than 1,300.

But, if the numbers of the previous four days are averaged together, it results in a 2,587 cases and 61,445 tests per-day average. That accounts for a 4.2 percent average positivity rate over the four-day period, bringing the rolling seven-day average rate to 4.1 percent.

IDPH officials said labs that process tests enter the numbers into an electronic reporting system that feeds the data to the state. The increase in testing capacity in Illinois led to the increase in data processing, which slowed the system down.

Upgrades to the system allow for faster processing and should prevent such a backlog from happening again, according to IDPH. The department also said there was no delay in the reporting of individual test results. The data being reported publicly was the same as data being viewed by state officials during the backlog, officials added.

IDPH also reported another 29 deaths from the virus, bringing the total to 8,143 since the pandemic first reached Illinois. Labs have confirmed more than 245,371 cases during that span with more than 4.3 million test results recorded.

At the end of Thursday, hospitalizations for the virus had remained nearly level from the day before. There were 1,621 people in Illinois hospitalized with COVID-19, including 360 in intensive care units and 155 on ventilators.

The state also reported 29 counties are at a warning level for novel coronavirus disease, which is one fewer than last week.  A county enters a warning level when two or more COVID-19 risk indicators measuring the amount of COVID-19 increase, including cases per 100,000 residents, hospital bed usage, test positivity rate and number of deaths among others.

The 29 counties include Boone, Bureau, Clinton, Coles, Cumberland, Edgar, Effingham, Fayette, Greene, Henry, Jasper, Jefferson, Jersey, Lake, Lawrence, Madison, McLean, Monroe, Pulaski, Randolph, Rock Island, Shelby, Stark, St. Clair, Union, Wabash, Warren, Williamson and Will.

Reasons for counties reaching the warning level vary, according to IDPH, but common factors include outbreaks associated with college parties, weddings, large gatherings, bars and clubs, long-term care facilities and other congregate settings, travel to neighboring states, and spread among members of the same household.

Capitol News Illinois is a nonprofit, nonpartisan news service covering state government and distributed to more than 400 newspapers statewide. It is funded primarily by the Illinois Press Foundation and the Robert R. McCormick Foundation.

Above is from:

September 4: Johns Hopkins COVID 19 Report

COVID-19

Updates on the emerging novel coronavirus pandemic from the Johns Hopkins Center for Health Security.

The Center for Health Security is analyzing and providing updates on the COVID-19 pandemic. If you would like to receive these updates, please subscribe below and select COVID-19. Additional resources are also available on our website.

Subscribe to our newsletter

The Johns Hopkins Center for Health Security also produces US Travel Industry and Retail Supply Chain Updates that provide a summary of major issues and events impacting the US travel industry and retail supply chain. You can access them here.

Monday, September 7 is Labor Day in the US, and our office will be closed. Our next update will be Wednesday, September 9.

EPI UPDATE The WHO COVID-19 Dashboard reports 26.17 million cases (285,387 new) and 865,154 deaths (6,014 new) as of 9:30am EDT on September 4.

On Wednesday, we looked at case fatality in the US, including at the state level, and today we will look at the global, continental, and national levels. Globally, the case fatality ratio continues to decrease, but it declines are beginning to taper off. After its earlier peak in mid-April (approximately 7.3%), the global average is down to 3.3%. Europe continues to report the highest case fatality (5.7%), but it is decreasing more rapidly than other continents. Europe’s elevated value is largely the result of limited testing capacity early in the pandemic, when case ascertainment was primarily limited to severe cases, as well as continued improvement to patient care.

It appears that the case fatality, both globally and for individual continents, is converging around 3%. However, there remains considerable variation between countries. Six (6) countries continue to report COVID-19 case fatality greater than 10%. Notably, 4 of these countries—Belgium, France, Italy, and the UK—were severely affected early in the pandemic, and all 4 are reporting decreasing trends. Yemen is reporting the world’s highest case fatality (29%). Yemen faces numerous major challenges to its COVID-19 response that undoubtedly contribute to its elevated COVID-19 case fatality, including its ongoing civil war, which has destroyed critical healthcare and public health infrastructure, and other ongoing health emergencies, such as the largest cholera epidemic in recorded history. Mexico’s case fatality has largely leveled off since early August, holding steady at approximately 11%. A number of other countries around the world are reporting case fatality greater than 5%. The majority of these countries are reporting decreasing trends; however, in addition to Yemen, Iran and Egypt have both reported increasing case fatality since approximately mid-June. As a reminder, the case fatality ratio is determined not just by the virus, but also by case ascertainment and factors related to underlying population health and medical care.

UNITED STATES

The US CDC reported 6.09 million total cases (41,193 new) and 185,092 deaths (1,009 new). The United States’ average mortality fell below 900 deaths per day for the first time since July 24. In total, 19 states (no change) are reporting more than 100,000 cases, including California with more than 700,000 cases; Florida and Texas with more than 600,000; New York with more than 400,000; and Arizona, Georgia, and Illinois with more than 200,000.

Guam continues to report extremely high per capita daily incidence. At 278 daily cases per million population, Guam’s per capita daily incidence has decreased significantly over the past week. The daily per capita incidence in the US Virgin Islands and Puerto Rico have both decreased as well, and both are now down to approximately the same level as the US national average.

The Johns Hopkins CSSE dashboard reported 6.16 million US cases and 187,052 deaths as of 12:30pm EDT on September 4.

INDIA Over the past several months, India’s daily COVID-19 incidence has steadily increased, now #1 globally with more than 78,000 new cases per day (nearly 30% of the global daily total). Early in the epidemic, the Indian government implemented a nationwide lockdown in an effort to contain the spread of the virus. Toward the end of the lockdown, public health experts expressed concern that relaxing the restrictions was risky. At that time, some experts believed that India had not sufficiently limited community transmission, and there was concern that lifting the restrictions would result in a rapid increase in social interaction and travel.

Like many countries, India has struggled to balance health and safety and economic activity. Recent analysis indicates that India’s economy contracted by approximately 20% in April-June compared to last year, and forecasts project that the annual GDP could decrease by more than 5% for 2020. Earlier this year, India’s Ministry of Finance announced that it will implement a US$265 billion stimulus package—equivalent to approximately 10% of India’s GDP—but some economists fear that only a small fraction of that will ultimately be spent and that it will have minimal effect on the economy.

Even as India works to gain control of its epidemic, efforts are ongoing to establish and scale up manufacturing capacity for future SARS-CoV-2 vaccines. India accounts for more than 60% of vaccines distributed to developing countries, and it is home to the world’s largest vaccine manufacturer, the Serum Institute of India (Pune). The Serum Institute has finalized an agreement with AstraZeneca to produce 1 billion doses of its vaccine (developed in collaboration with the University of Oxford). Notably, India will be able to keep half of its production capacity for domestic use, and it will distribute the other half to developing countries. In order to achieve this capacity, the Serum Institute has converted 2 facilities that previously manufactured other vaccines and invested US$200 million. Other pharmaceutical manufacturing companies in India have entered similar agreements to produce other vaccines.

SAUDI ARABIA An investigation by The Sunday Telegraph (UK) identified migrant detention centers in Saudi Arabia, where “hundreds if not thousands of African migrants” are being held indefinitely. The detainees are reportedly being held in inhumane conditions, in small, densely populated rooms with little or no access to health care or other services. In August, Human Rights Watch reported that Houthi forces in Yemen “us[ed] Covid-19 as a pretext” to “forcibly expel thousands of Ethiopian migrants” across the border into Saudi Arabia. As we have covered previously, racial and ethnic minorities in countries around the world are bearing a disproportionate burden from COVID-19, including both incidence and disease severity. Previously, the Saudi Ministry of Health reported the proportion of COVID-19 cases among citizens and non-citizens. At the time, the majority of cases (on the order of 75% or more) of its COVID-19 cases were non-Saudis, many of whom were migrant workers. Additional data indicate that COVID-19 incidence among non-Saudis exceeded incidence among Saudi citizens through early June.

COVID-19 NOTIFICATION APPS Countries and organizations around the world—including US colleges and universities, as covered earlier this week—are launching mobile/smartphone applications to support COVID-19 contact tracing and notification efforts. Finland launched its application earlier this week. Much like other similar approaches, the Finnish product operates using bluetooth technology and can notify potential contacts anonymously. It does not collect personally identifiable or location information, and users must update their own testing information (eg, to notify of a positive test). Participation is voluntary, but reportedly more than a quarter of Finland’s population downloaded the application within 4 days of its release. Future iterations of the application aim to make it compatible with similar products in other European countries. South Africa’s contact tracing application functions in much the same way, and many of these applications use software developed by Google and Apple (to ensure privacy and security) to support the bluetooth functionality and notification. One list, published by XDA Developers, indicates that more than 30 national and state governments have developed and released contact tracing applications utilizing this framework, and numerous others are in various stages of development.

GLOBAL VACCINE ACCESS The European Commission and Japan recently indicated that they will join and support the COVID-19 Vaccine Global Access Facility (COVAX), a global initiative run by the WHO, Gavi, and CEPI to increase accessibility of a COVID-19 vaccine, particularly among low- and middle-income countries. The deadline for binding commitments to the program is September 18, and the first round of payments will be due no later than October 9. The European Commission has pledged €400 million (~US$475 million), but Japan has not yet specified the magnitude of its commitment. The initiative focuses on funding the development and scale-up of vaccine production capacity with the goal of ensuring that low- and middle-income countries can have access to at least 2 billion doses by the end of 2021, enabling immunization coverage for at least 20-30% of their populations. COVAX aims to pool resources so that lower-income countries are able to better compete financially against higher-income countries to procure initial doses of the vaccine. A total of 172 countries have pledged to engage in the initiative. Notably, 80 of these countries are high-income, self-financing countries that have only submitted “non-binding expressions of interest.” Funding from these countries will be critical for financing COVAX, so the next several weeks will be extremely important in terms of determining the future of the COVAX effort. The US government has declined to contribute to the program due to the involvement of the WHO. As of last week, approximately US$1 billion was still urgently needed to move the program forward.

ANTIBIOTIC USE & DRUG-RESISTANT INFECTIONS A study published in Clinical Infectious Diseases examines the use of antibiotics in COVID-19 patients compared to the prevalence of bacterial coinfections. The researchers analyzed data from more than 1,700 hospitalized COVID-19 patients across 38 hospitals in Michigan (US). They found that more than half of the patients received antibiotic treatment within 2 days of hospitalization (27-84% in individual hospitals), while only 3.5% had a community-onset bacterial infection. One researcher stated that they anticipated a higher rate of bacterial coinfection among COIVD-19 patients and that early prescribing practices may have led to more antibiotic use in the absence of approved COVID-19 treatments. The researchers also posited that delays in obtaining results for SARS-CoV-2 tests may have also contributed to increased antibiotic use.

Another study, published in the US CDC’s Emerging Infectious Diseases journal, explores the incidence of multidrug-resistant Candida auris infection in critical COVID-19 patients in India. Among a total of 596 COVID-19 patients admitted to an intensive care unit (ICU) in New Delhi, the researchers identified 15 cases of candidemia (2.5%). Of those cases, 10 of the infections were C. auris, and 6 of those patients died (60%). Among these 10 C. auris infections, 7 were multidrug resistant, including 3 that were resistant to 3 classes of antifungals. While C. auris is a fungal infection rather than a bacterial infection, this case study provides valuable insight into the risk of hospital-acquired multidrug-resistant infections in the context of COVID-19.

VACCINE PHASE 1/2 TRIAL DATA Novavax, Inc., published data from the Phase 1, randomized, placebo-controlled clinical trial for its SARS-CoV-2 vaccine candidate. The data, published in The New England Journal of Medicine, demonstrates that the vaccine has an acceptable safety profile to progress to Phase 2 clinical trials. The trial administered the vaccine to 108 participants (plus an additional 23 control subjects, who received the placebo). Of these participants, 26 received a single 25-μg dose (adjuvanted; plus one dose of placebo), 25 received two 25-μg doses (unadjuvanted), 28 received two 25-μg doses (adjuvanted), and 29 received two 5-μg doses (adjuvanted). No serious adverse events were reported, and local and systemic reactogenicity was generally mild in all participant groups. In addition to the safety data, Novavax reported that all participants who received the vaccine generated neutralizing antibodies, and those receiving a second dose produced elevated antibody levels compared to those who received a single dose. The vaccine utilizes recombinant nanoparticles, and it is adjuvanted to boost immune response. Phase 2 clinical trials are already underway in Australia, South Africa, and the US.

Today, Russian researchers published findings from Phase 1/2 clinical trials for Russia’s vaccine, commonly referred to as Sputnik V. The study, published in The Lancet, included 76 total participants, 38 each in 2 separate studies conducted at 2 hospitals in Russia. The Russian vaccine uses a combination of 2 recombinant human adenovirus vectors (rAd26 and rAd5), and both studies evaluated the adenovirus strains both independently and together. The study also included both frozen and lyophilised formulations of the vaccine. In Phase 1 of each trial, 9 participants received just the rAd26 component and 9 participants received just the rAd5 component. These participants were evaluated for safety over 28 days. In Phase 2 of each study, 20 participants were given a prime-boost formulation of the vaccine, receiving the rAd26 component on Day 0 and rAd5 component on Day 21. These participants were evaluated for both safety and efficacy over a period of 42 days. Notably, there was no placebo involved in these trials. No serious adverse events were reported, and most adverse events were mild. The participants also exhibited promising immune response, including receptor binding domain-specific IgG response and neutralizing antibodies. The researchers note that further investigation is needed to better characterize the vaccine’s efficacy, including in Phase 3 trials. Last month, the Russian government reportedly approved the vaccine for public use, despite not having completed Phase 3 clinical trials. Senior Russian government officials indicated that Phase 3 trials could commence in August, but it does not appear that these trials have begun recruitment.

LONG-TERM EFFECTS A study (not yet peer reviewed) by researchers at Gladstone Institutes (California, US) identified severe damage to heart tissue due to SARS-CoV-2 infection. The study (preprint) exposed cardiac cells to SARS-CoV-2 in vitro and found that muscle fibers were severed, similar to observations of heart tissue from deceased COVID-19 patients. The researchers exposed 3 types of cardiac cells—cardiomyocytes (muscle cells), cardiac fibroblasts, and endothelial cells—and only the cardiomyocytes exhibited the severe damage. The researchers believe that this type of damage, described by one researcher as “carnage,” could potentially explain longer-term health effects in COVID-19 survivors, including shortness of breath. It is possible that the damage could be permanent, which could increase the risk of heart failure as affected patients grow older; however, further study is needed to study this effect in vivo and to characterize the body’s ability to repair this kind of damage over the longer term.

September 3: 1360 New COVID-19 Cases in Illinois


Daily Count:  24 additional fatalities in the US.. 9 additional cases in Boone County.


Are Americans KIA “losers”?

Trump: Americans Who Died in War Are ‘Losers’ and ‘Suckers’

The president has repeatedly disparaged the intelligence of service members, and asked that wounded veterans be kept out of military parades, multiple sources tell The Atlantic.

JEFFREY GOLDBERGSEPTEMBER 3, 2020

3more free articles this month

Sign in

Subscribe Now

Donald Trump greets families of the fallen at Arlington National Cemetery on Memorial Day 2017.CHIP SOMODEVILLA / GETTY

  • Link Copied

When President Donald Trump canceled a visit to the Aisne-Marne American Cemetery near Paris in 2018, he blamed rain for the last-minute decision, saying that “the helicopter couldn’t fly” and that the Secret Service wouldn’t drive him there. Neither claim was true.

Trump rejected the idea of the visit because he feared his hair would become disheveled in the rain, and because he did not believe it important to honor American war dead, according to four people with firsthand knowledge of the discussion that day. In a conversation with senior staff members on the morning of the scheduled visit, Trump said, “Why should I go to that cemetery? It’s filled with losers.” In a separate conversation on the same trip, Trump referred to the more than 1,800 marines who lost their lives at Belleau Wood as “suckers” for getting killed.


Belleau Wood is a consequential battle in American history, and the ground on which it was fought is venerated by the Marine Corps. America and its allies stopped the German advance toward Paris there in the spring of 1918. But Trump, on that same trip, asked aides, “Who were the good guys in this war?” He also said that he didn’t understand why the United States would intervene on the side of the Allies.


Trump’s understanding of concepts such as patriotism, service, and sacrifice has interested me since he expressed contempt for the war record of the late Senator John McCain, who spent more than five years as a prisoner of the North Vietnamese. “He’s not a war hero,” Trump said in 2015 while running for the Republican nomination for president. “I like people who weren’t captured.”


There was no precedent in American politics for the expression of this sort of contempt, but the performatively patriotic Trump did no damage to his candidacy by attacking McCain in this manner. Nor did he set his campaign back by attacking the parents of Humayun Khan, an Army captain who was killed in Iraq in 2004.

Trump remained fixated on McCain, one of the few prominent Republicans to continue criticizing him after he won the nomination. When McCain died, in August 2018, Trump told his senior staff, according to three sources with direct knowledge of this event, “We’re not going to support that loser’s funeral,” and he became furious, according to witnesses, when he saw flags lowered to half-staff. “What the fuck are we doing that for? Guy was a fucking loser,” the president told aides. Trump was not invited to McCain’s funeral. (These sources, and others quoted in this article, spoke on condition of anonymity. The White House did not return earlier calls for comment, but Alyssa Farah, a White House spokesperson, emailed me this statement shortly after this story was posted: “This report is false. President Trump holds the military in the highest regard. He’s demonstrated his commitment to them at every turn: delivering on his promise to give our troops a much needed pay raise, increasing military spending, signing critical veterans reforms, and supporting military spouses. This has no basis in fact.”)


Trump’s understanding of heroism has not evolved since he became president. According to sources with knowledge of the president’s views, he seems to genuinely not understand why Americans treat former prisoners of war with respect. Nor does he understand why pilots who are shot down in combat are honored by the military. On at least two occasions since becoming president, according to three sources with direct knowledge of his views, Trump referred to former President George H. W. Bush as a “loser” for being shot down by the Japanese as a Navy pilot in World War II. (Bush escaped capture, but eight other men shot down during the same mission were caught, tortured, and executed by Japanese soldiers.)

When lashing out at critics, Trump often reaches for illogical and corrosive insults, and members of the Bush family have publicly opposed him. But his cynicism about service and heroism extends even to the World War I dead buried outside Paris—people who were killed more than a quarter century before he was born. Trump finds the notion of military service difficult to understand, and the idea of volunteering to serve especially incomprehensible. (The president did not serve in the military; he received a medical deferment from the draft during the Vietnam War because of the alleged presence of bone spurs in his feet. In the 1990s, Trump said his efforts to avoid contracting sexually transmitted diseases constituted his “personal Vietnam.”)


On Memorial Day 2017, Trump visited Arlington National Cemetery, a short drive from the White House. He was accompanied on this visit by John Kelly, who was then the secretary of homeland security, and who would, a short time later, be named the White House chief of staff. The two men were set to visit Section 60, the 14-acre area of the cemetery that is the burial ground for those killed in America’s most recent wars. Kelly’s son Robert is buried in Section 60. A first lieutenant in the Marine Corps, Robert Kelly was killed in 2010 in Afghanistan. He was 29. Trump was meant, on this visit, to join John Kelly in paying respects at his son’s grave, and to comfort the families of other fallen service members. But according to sources with knowledge of this visit, Trump, while standing by Robert Kelly’s grave, turned directly to his father and said, “I don’t get it. What was in it for them?” Kelly (who declined to comment for this story) initially believed, people close to him said, that Trump was making a ham-handed reference to the selflessness of America’s all-volunteer force. But later he came to realize that Trump simply does not understand non-transactional life choices.

“He can’t fathom the idea of doing something for someone other than himself,” one of Kelly’s friends, a retired four-star general, told me. “He just thinks that anyone who does anything when there’s no direct personal gain to be had is a sucker. There’s no money in serving the nation.” Kelly’s friend went on to say, “Trump can’t imagine anyone else’s pain. That’s why he would say this to the father of a fallen marine on Memorial Day in the cemetery where he’s buried.”

I’ve asked numerous general officers over the past year for their analysis of Trump’s seeming contempt for military service. They offer a number of explanations. Some of his cynicism is rooted in frustration, they say. Trump, unlike previous presidents, tends to believe that the military, like other departments of the federal government, is beholden only to him, and not the Constitution. Many senior officers have expressed worry about Trump’s understanding of the rules governing the use of the armed forces. This issue came to a head in early June, during demonstrations in Washington, D.C., in response to police killings of Black people. James Mattis, the retired Marine general and former secretary of defense, lambasted Trump at the time for ordering law-enforcement officers to forcibly clear protesters from Lafayette Square, and for using soldiers as props: “When I joined the military, some 50 years ago, I swore an oath to support and defend the Constitution,” Mattis wrote. “Never did I dream that troops taking that same oath would be ordered under any circumstance to violate the Constitutional rights of their fellow citizens—much less to provide a bizarre photo op for the elected commander-in-chief, with military leadership standing alongside.”


Another explanation is more quotidian, and aligns with a broader understanding of Trump’s material-focused worldview. The president believes that nothing is worth doing without the promise of monetary payback, and that talented people who don’t pursue riches are “losers.” (According to eyewitnesses, after a White House briefing given by the then-chairman of the Joint Chiefs of Staff, General Joe Dunford, Trump turned to aides and said, “That guy is smart. Why did he join the military?”)

Yet another, related, explanation concerns what appears to be Trump’s pathological fear of appearing to look like a “sucker” himself. His capacious definition of sucker includes those who lose their lives in service to their country, as well as those who are taken prisoner, or are wounded in battle. “He has a lot of fear,” one officer with firsthand knowledge of Trump’s views said. “He doesn’t see the heroism in fighting.” Several observers told me that Trump is deeply anxious about dying or being disfigured, and this worry manifests itself as disgust for those who have suffered. Trump recently claimed that he has received the bodies of slain service members “many, many” times, but in fact he has traveled to Dover Air Force Base, the transfer point for the remains of fallen service members, only four times since becoming president. In another incident, Trump falsely claimed that he had called “virtually all” of the families of service members who had died during his term, then began rush-shipping condolence letters when families said the president was not telling the truth.


Trump has been, for the duration of his presidency, fixated on staging military parades, but only of a certain sort. In a 2018 White House planning meeting for such an event, Trump asked his staff not to include wounded veterans, on grounds that spectators would feel uncomfortable in the presence of amputees. “Nobody wants to see that,” he said.

We want to hear what you think about this article. Submit a letter to the editor or write to letters@theatlantic.com.

JEFFREY GOLDBERG is the editor in chief of The Atlantic and a recipient of the National Magazine Award for Reporting. He is the author of Prisoners: A Story of Friendship and Terror.