Monday, May 4, 2020

State Projections from University of Washington Study: 5-4-2020


Projections from University of Washington Study
FROM:  http://www.healthdata.org/research-article/forecasting-covid-19-impact-hospital-bed-days-icu-days-ventilator-days-and-deaths
Home

Over the last weeks the IHME model has had some major swings in death projections for a number of states. The model is driven by updated data which is imputed three times per week.  For a description and discussion of the model GO TO:  http://boonecountywatchdog.blogspot.com/2020/03/forecasting-covid-19-impact-on-hospital.html

PROJECTION:

As of MAY 4, 2020, 2020

United States of America:  (134,475  4-5-2020)  (74,073 2-27-2020) (67,641 4-22-2020)  (60,308  4-15-2020)  (68,841 4-13-2020) (61,545 4-10-2020)  (60,415 4-8-2020)  (81,766 4-5-2020) (93,531 4-4-2020) (93,765 4-1-2020)  Deaths

>Population 331 Millions  (2020)   406.27 per million

*******************************************************************************************************

Arizona (1,043  5-4-2020)

> 7.279 millions (2019)       143.29 per million

California (4,666  5-4-2020) (2,017  4-27-2020)  (1719  4-22-2020) ( 1,658  4-15-2020)  (1,483  4-13-2020)(1616 4-10-2020) (1,611 4-8-2020)  (1,783   4-5-2020) (5,068 4-3-2020) (5,161 4-1-2020) 

>39.56 millions (2018)   117.95 per million

Florida: (3,971 5-4-2020) (1,914  4-27-2020) (1,620  4-22-2020)  (1,363  4-15-2020) (4,748  4-13-2020)  (3999 4-10-2020) (4,357 deaths 4-8-2020) (6770 4-5-2020) (6,897 4-3-2022)(6,937 4-1-2020)

>Population  21.3 million (2018)   186.43 per million

Illinois: (6,353  5-4-2020) (2316 4-27-2020) (2138  4-22-2020)  (2,259 4-15-2020)   (1,248 4-13-2020) (777 4-10-2020) (1,588 deaths 4-8-2020) (3,629 4-5-2020)(3,386  4-3-2020) (2786 4-1-2020)

>12.74 million (2018)  498.66 per million

Louisiana: (2,822 5-4-2020) (2,066  4-27-2020)   (1,780  4-22-2020)  (1,685  4-15-2020) (1,141  4-13-2020)  (1,125  4-10-2020) (946 deaths 4-8-2020) 746 4-5-2020

>4.6 million (2018)   613.48  per million

Massachusetts (7,697  5-4-2020) (5,498  4-27-2020)  (4,242  4-22-2020)  (3,236  4-15-2020) (8,219  4-13-2020) (6,739  4-10-2020) (5,625 4-8-2020) 8,254 deaths

>6.9 million (2018)    1115.51 per million

Michigan  (7,080  5-4-2020)  (3,785  4-27-2020)

> 9.987 million (2019)        708.92 per million

MINNESOTA (2,183 5-4-2020)  (688  4-27-2020)   (360  4-22-2020) (195 4-15-2020)  (656  4-13-2020) 456 deaths 4-8-2020

>5.6 million  (2018)    389.82  per million

MISSOURI: (1,243 5-4-2020)  (537  4-27-2020)  (438 4-22-2020) (362  4-15-2020)   (1,712 4-13-2020)  (1,161   4-10-2020)

>6.126 million    202.91 per million

NEBRASKA  (380  5-4-2020) (463 4-27-2020)  (347 4-22-2020)

>1.9346  million   196.42 per million

New York (32,132  5-4-2020)  (23,930 4-27-2020)  (23,232 4-22-2020)  (21,812  4-15-2020)  (14,542  4-13-2020)  (13,442  4-10-2020)  13,307 death 4-8-2020) (15,618 4-5-2020) (16,261 4-3-2020) (16,090 4-1-2020)

>19.54 million (2018)  1,644.42 per million

Ohio: (2,552  5-4-2020)   (853  4-27-2020) (808  4-4-22-2020) (716  4-15-2020)  (482 4-13-2020) (489  4-10-2020)  (489 4-8-2020) 544

>11.69 million (2018)   218.31 per million

Pennsylvania (8,607 5-4-2020) (2596  4-27-2020)  (2,770  4-22-2020)  (1,707 4-15-2020)   (2,005  4-13-2020)

>12.8 million  (2019)    672.42 per million

Texas: (3,632  5-4-2020)  (1,656  4-27-2020)  (1,241  4-22-2020)  (957  4-15-2020)  (2,704  4-13-2020)  (2,350 4-10-2020)  (2,042 4-8-2020)  (2,025 4-5-2020)

>28.7 million (2018)   126.55 per million

Virginia (1,198 5-4-2020) (684 4-27-2020) (762 4-22-2020)  (763  4-15-2020)

> 8.536 million    140.35 per million

Washington: (1,159 5-4-2020) (841 4-27-2020)  (813 4-22-2020)  (694  4-15-2020) (855 4-13-2020)  (842 4-10-2020)  (700 4-8-2020) (632  4-5-2020) (978 4-3-2020) (1,233 4-1-2020)

>7.536 million (2018)    153.80 per million

Wisconsin (717 5-4-2020)  (331 4-27-2020)   (356  4-22-2020) (302  4-15-2020)   (339  4-13-2020)  (357 4-10-2020)  (424 4-8-2020) (644 deaths 4-5-2020) (951 4-3-2020) (926 4-1-2020)

>5.814 Million (2018)    123.32 per million

Northern Illinois COVID-19 cases by zip code

's a look at the cases by the zip code in the Stateline as of 4:30 p.m. Monday:

WINNEBAGO COUNTY

  • 61016 - 17 confirmed, 99 tested
  • 61101 - 65 confirmed, 480 tested
  • 61102 - 74 confirmed, 395 tested
  • 61103 - 63 confirmed, 438 tested
  • 61104 - 90 confirmed, 337 tested
  • 61107 - 41 confirmed, 356 tested
  • 61108 - 94 confirmed, 432 tested
  • 61109 - 73 confirmed, 446 tested
  • 61111 - 21 confirmed, 257 tested
  • 61114 - 30 confirmed, 162 tested
  • 61115 - 22 confirmed, 232 tested
  • 61072 - 8 confirmed, 78 tested
  • 61073 - 12 confirmed, 160 tested
  • 61080 - 12 confirmed, 77 tested

BOONE COUNTY

  • 61008 - 126 positive, 394 tested
  • 61065 - 14 positive, 110 tested

OGLE COUNTY

  • 61064 - 8 positive, 46 tested
  • 61068 - 98 positive, 710 tested
  • 61084 - 6 positive, 21 tested

STEPHENSON COUNTY

  • 61032 - 63 positive, 272 tested

LEE COUNTY

  • 61021 - 16 positive, 393 tested

Above is from:  https://wrex.com/2020/05/04/taking-a-look-at-covid-19-cases-by-zip-code-in-the-stateline/

World Projections from University of Washington Study: 5-4-2020


Projections from University of Washington Study

Projected Deaths are through 8-4-2020.  Projections were supplied by IHME on 5-4--2020,

FROM:  http://www.healthdata.org/research-article/forecasting-covid-19-impact-hospital-bed-days-icu-days-ventilator-days-and-deaths
Home
All listed countries (with exception of Finland)  have sizeable increases in projected deaths.  This no doubt reflects the various changes in the IHME model.  The US death projection (406) now appears similar to these four high death rate  nations:   UK (608), Spain (590), Italy (521) and France (442).

The lower death projection countries are Greece (14), Norway (53), Finland (54), Germany (103), Denmark (140)  and Ireland (343).


***************************************************************************************************************************************************************************

United States of America—population 331 million (2020)

peak:  1,983 on 4-11-2020

Total Death Projected:  (134,475  5-4-2020)   (72,860 4-28-2020) (65,976 4-21-2020) (60,308 4-15-2020)   (68,841 4-10-2020)  (61,545 4-10-2020)

Deaths per million: 406.27

******************************************************************************************************************************************************************

UNITED KINGDOM—population 66.65 million  (2019)

peak:  ( 1,285 on  4-21-2020)1,156 on 4-13-2020

Total Death Projected (40,555 5-4-2020)  (31,476 4-28-2020)  (33,142  4-21-2020)  (37,521 4-15-2020)   (23,791 4-13-2020)  (37,494 4-10-2020)

Deaths per million: 608.48

**************************************************************************************************************************

SWEDEN—population 10.23 million (2019)

Peak:    (204 on 5-19-2020)  (127 ON 5-1-2020) on 5-8-2020

Total Death Projected (10,196 5-4-2020)  (15,625  4-28-2020)   (9191 4-21-2020) (15,890 4-15-2020)  (18,322  4-13-2020)  (13,259 4-10-2020)

Deaths per million:  996.68

*******************************************************************************************************************************

SPAIN—population 46.94 million (2019)

Peak;  950 on 4-1-2020

Total  Deaths Projected:  (27,727 5-4-2020) (25,329  4-28-2020) (24,624 4-21-2020)   (23,680 4-15-2020)  (18,713  4-13-2020)   (18,363  4-10-2020)

Deaths per million:  590.69

***************************************************************************************************************************************

NORWAY—population 5.368 million  (2019)

peak:  19 on 5-4-2020

Total Deaths Projected:  (284 5-4-2020)  (336 4-21-2020)   ( 280  4-17-2020)( 811 4-13-2020)

Deaths per million:  52,91*

*Through May4, 2020

*******************************************************************************************************************************************

ITALY—population 60.36  million (2019)

peak:  969 3-27-2020

Total Deaths Projected     (31,458 5-4-2020) (27,544  4-29-2020)  (26,600  4-21-2020) (26,007  4-17-2020) (21,130 4-13-2020) (20,333 4-10-2020)

Deaths per million:  521.17

**************************************************************************************************************************************

IRELAND—population 4.94 million  (2020)

peak:  36 on 4-7-2020

Total Deaths Projected: (1,698 5-4-2020)  (1,404  4-28-2020) (987  4-21-2020)  (890 4-17-2020)  (527  4-13-2020) (500 4-13-2020)

Deaths per million: 343,73

****************************************************************************************************************************************

GREECE—population 10.72  (2019)

peak  11 on 4-23-2020

Total Deaths Projected (152 5-4-2020)   (140  4-28-2020)  (123 4-21-2020)  (119  4-17-2020)  (374  4-13-2020)

Deaths per million:  14,18

********************************************************************************************************************************************

GERMANY—population 83.02 million  (2019)

peak:  247 on 4-12-2020

Total Deaths Projected:  (8,543  5-4-2020)  (6,946   4-28-2020)   (5913  4-21-2020)  (4,957  4-17-2020)  (7,332 4-13-2020) (7,080 4-10-2020)

Deaths per million:   102.90

*************************************************************************************************************************************************

FRANCE—population 65.27 million (2020)

peak:  920 on 4-6-202

Total Projected Deaths:   (28,859 5-4-2020)  (24,918  4-28-2020)  (23,104  4-21-2020)  (22,555  4-17-2020 )(17,448  4-13-2020)  (15,741  4-10-2020)

Deaths per million:  442.15

***************************************************************************************************************************************************

FINLAND—population 5.52  (2019)

peak 8 on 4-13-2020

Total Projected Deaths: (299 5-4-2020)  (433  4-28-2020)  (167  4-21-2020)   (118 4-17-2020)

Deaths per million:  54.17

******************************************************************************************************************************************************

DENMARK—population 5.77 (2019)

peak 45 on 5-4-2020

Total Projected deaths(806 5-4-2020)  (559 4-28-2020)  (772  4-21-2020) (683  4-17-2020)(1,669 4-13-2020)

Deaths per million:  139.67

IHME model nearly doubles death projection—now 135,000


Coronavirus model projects 135,000 deaths in US, nearly double its last estimate

By Eric Levenson, Madeline Holcombe and Arman Azad, CNN

Updated 4:07 PM ET, Mon May 4, 2020


(CNN)An influential coronavirus model often cited by the White House said in a press release that it plans to revise its projections to nearly 135,000 Covid-19 deaths in the United States, nearly double its previous prediction.

The model, from the Institute for Health Metrics and Evaluation at the University of Washington, previously predicted 72,433 deaths as of Monday morning. A press release from IHME said the full set of new projections will be released later this afternoon.

Relatedly, a Trump administration model projects a rise in coronavirus cases and deaths in the weeks ahead, up to about 3,000 daily deaths in the US by June 1, according to an internal document obtained by The New York Times. Over the past week, about 2,000 people died daily in the US, according to data from Johns Hopkins University.

The sharp increases in the two models are tied to relaxed social distancing and increased mobility in the US. States across the country -- including Florida, Colorado, Indiana, Nebraska and South Carolina -- have eased restrictions in an attempt to revive a sputtering economy and calm restless residents.

    The projections make clear that these reopenings come with fatal risks.

    "It's simple logic," CNN's senior medical correspondent Elizabeth Cohen said. "When you tell people, 'Hey, you can go to bars, you can get your nails done, you can go to a restaurant,' those numbers are going to go up."

    The novel coronavirus's incubation period -- or the time from exposure to developing symptoms -- ranges from two to 14 days, according to the CDC, and the virus can even spread among people who show no symptoms at all. With widespread testing still limited, the consequences of these reopenings may not be evident for several weeks.

    Ali Mokdad, a professor of Health Metrics Sciences at IHME, told CNN's John King on Monday that there are "several reasons" for the increased projections.


    "One of them is increased mobility before the relaxation, premature relaxation, of social distancing," he said. "We're adding more presumptive deaths as well, and we're seeing a lot of outbreaks in the Midwest, for example."

    He said multiple variables impact infections -- like heat, testing capacity and population density -- but "the most important one is mobility."

    Right now, he said, "we're seeing an increase in mobility that's leading to an increase in mortality, unfortunately, in the United States."

    Coronavirus has killed 68,285 people in the US and infected more than 1,171,000 others, according to data from Johns Hopkins University.

    President Donald Trump had previously said he expected 65,000 Americans to die, but on Sunday night, he revised that estimated death toll up to 80,000-90,000 people. It may not be the last upward revision; Dr. Deborah Birx, a White House coronavirus task force official, said projections have shown between 100,000 to 240,000 American deaths, even with social distancing.

    …..

    Above is from: https://www.cnn.com/2020/05/04/health/us-coronavirus-monday/index.html

    CDC: What are other models projecting?

    COVID-19 Forecasts

    Below is from:  https://www.cdc.gov/coronavirus/2019-ncov/covid-data/forecasting-us.html


    Updated May 1, 2020

    On This Page

    Why Forecasting COVID-19 Deaths in the US is Critical

    CDC is responding to a pandemic of coronavirus disease 2019 (COVID-19) caused by a novel coronavirus, SARS-CoV-2, that is spreading from person to person. The federal government is working closely with state, tribal, local, and territorial health departments, and other public health partners, to respond to this situation.  Forecasts of deaths will help inform public health decision-making by projecting the likely impact in coming weeks.

    What the Forecasts Aim to Predict

    Forecasts based on the use of statistical or mathematical models (subsequently referred to as “models”) aim to predict changes in national- and state-level cumulative reported COVID-19 deaths for the next four weeks. Forecasting teams predict numbers of deaths using different types of data (e.g., COVID-19 data, demographic data, mobility data), methods (see below), and estimates for the impacts of interventions (e.g. social distancing, use of face coverings).

    Interpretation of Forecasts

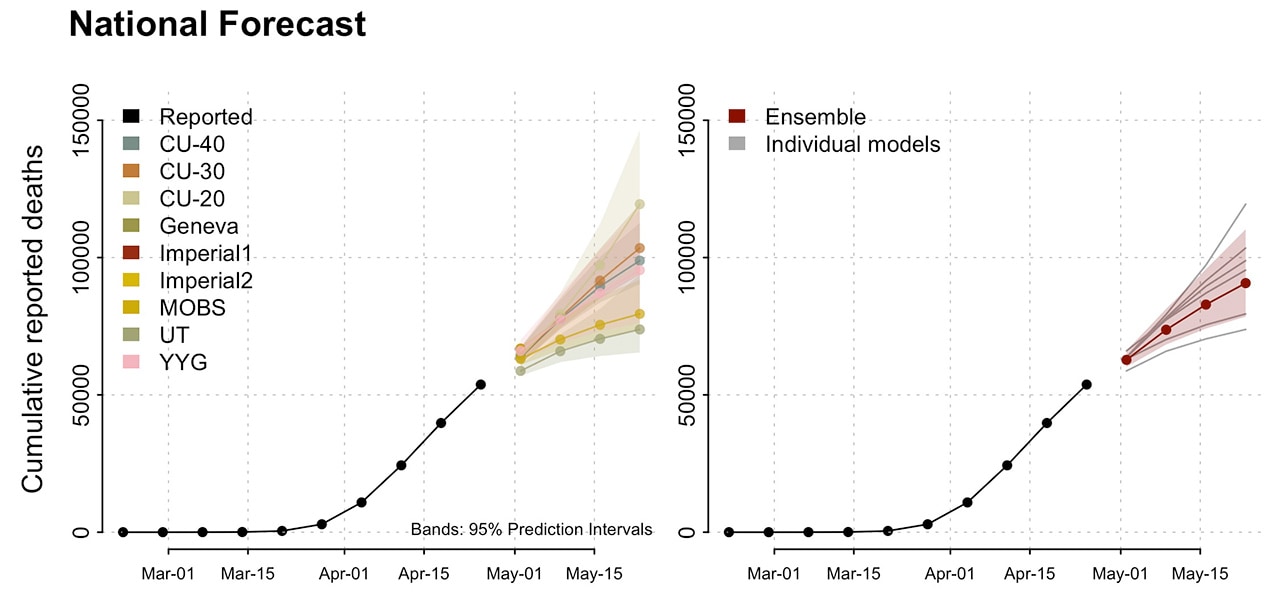
    • This week’s forecasts include national- and state-level forecasts from additional modeling groups and “ensemble” forecasts that summarize the information from the individual forecasts.
    • National-level forecasts continue to indicate that deaths are likely to rise in the coming weeks. How quickly they will increase remains uncertain and is dependent on forecast assumptions about the strength and coverage of social distancing behaviors that continue over this period.
    • State-level ensemble forecasts (only shown for states and territories with at least two forecasts) indicate a slowed growth in new deaths for most states.

    National Forecast

    National Forecast as of April 27, 2020

    • These forecasts show cumulative reported COVID-19 deaths since February and forecasted deaths for the next four weeks in the United States.
    • The CU models make various assumptions about the effectiveness of current interventions. All other models assume that existing social distancing measures will continue through the time period shown.

    State Forecasts

    State level forecasts show observed and forecasted state level cumulative COVID-19 deaths in the US.

    Forecasts fall into one of three categories

    • The LANL and UMass-MB models do not explicitly model the effects of individual social distancing measures but assume that implemented interventions will continue, resulting in decreased growth.
    • The Geneva, MIT, MOBS, UT, and YYG models are conditional on existing social distancing measures continuing through the projected time period.
    • The CU models make different assumptions about the effectiveness of current social distancing interventions.

    Download state forecasts pdf icon[PDF – 186 KB]

    Download model data excel icon[XLS – 396 KB]

    Working to Bring Together Forecasts for COVID-19 Deaths in the US

    CDC works with partners to bring together weekly forecasts for COVID-19 deaths in one place. These forecasts have been developed independently and shared publicly. It is important to bring these forecasts together to help understand how they compare with each other and how much uncertainty there is about what may happen in the upcoming four weeks.

    Columbia University external icon

    Model names: CU 20% contact reduction, CU 30% contact reduction, CU 40% contact reduction

    Intervention assumptions
    These models are based on assumptions of reducing the number of contacts per case. Three different adaptive scenarios of contact reduction are projected: 20%, 30%, and 40% contact reduction in US counties with at least 10 cases. Additional reductions are implemented with additional new cases, and all social distancing interventions remain in place until the end of the projection.

    Methods
    Metapopulation SEIR model

    Imperial College, London external icon

    Model names: Imperial1, Imperial2

    Intervention Assumptions:

    These projections do not make any specific assumptions about which interventions have been or will remain in place.

    Methods: Ensembles of mechanistic transmission models, fit to different parameter assumptions.

    Los Alamos National Laboratory (state-level forecasts only)external icon

    Model name: LANL

    Intervention assumptions
    Currently implemented interventions and the corresponding reductions in transmission will continue, resulting in an overall decrease in the growth rate of COVID-19. Over the course of the forecast, the model assumes that the growth will decrease over time.

    Methods
    Statistical dynamical growth model accounting for population susceptibility

    Massachusetts Institute of Technology external icon

    Model names: MIT

    Intervention Assumptions: The projections assume that current interventions will remain in place indefinitely.

    Methods: SEIR model fit to reported death and case counts.

    Northeasterne xternal icon

    Model name: MOBS (Laboratory for the Modeling of Biological + Socio-technical Systems)

    Intervention assumptions
    The projections assume that social distancing policies in place at the date of calibration are extended for the future weeks.

    Methods
    Metapopulation, age-structured SLIR model

    University of Geneva (one-week ahead forecasts only)external icon

    Model name: Geneva

    Intervention assumptions
    The projections assume that social distancing policies in place at the date of calibration are extended for the future weeks.

    Methods
    Exponential and linear statistical models fit to the recent growth rate of cumulative deaths.

    University of Massachusetts, Amherstexternal icon

    Model name: UMass-MB

    Intervention assumptions
    These projections do not make any specific assumptions about which interventions have been or will remain in place.

    Methods: Mechanistic Bayesian compartment model.

    University of Texas, Austinexternal icon

    Model name: UT

    Intervention assumptions
    Estimates the extent of social distancing using geolocation data from mobile phones and assumes that the extent of social distancing does not change during the period of forecasting. The model is designed to predict confirmed COVID-19 deaths resulting from only a single wave of transmission.

    Methods
    Nonlinear Bayesian hierarchical regression with a negative-binomial model for daily variation in death rates.

    Youyang Gu (COVID-Projections)external icon

    Model name: YYG

    Intervention assumptions
    The projections assume that strong social distancing policies will remain in place through the projected period.

    Methods
    SEIS mechanistic model.

    Additional Resources:

    May 4: 63,840 COVID-19 cases in Illinois


    In response to the COVID-19 pandemic, Gov. JB Pritzker has ordered Illinois residents to stay at home. Executive Order No. 10 requires all residents to stay home, with exceptions for essential needs or business activities. Gatherings of 10 people or more are prohibited. The order extends through May 30, 2020.
    COVID-19 Statistics
    Positive (Confirmed)
    63,840  +2,341
    Deaths
    2,662   +44 
    Total Tests Performed*
    319,313  +13,724
    Total Cases
    (63,840  5-4-2020) (61,499 5-3-2020) (58,505  5-2-2020)  56,055 5-1-2020) (52,918  4-30-2020) (50,355  4-29-3030) (48,102 4-28-2020) (45,883  4-27-2020) (43,903  4-26-2020) ( 41,777  4-25-2020) (39,658  4-24-2020)  (36,934 4-23-2020)  (35,108 4-22-2020)(33,059  4-21-2020) (31,508  4-20-2020) (30,357 4-19-2020)  (29,160  4-18-2020)  (27,575  4-17-2020) (25,733  4-16-2020)  (24,593 4-15-2020)  (23,247 4-14-2020)  (22,025 4-13-2020)  (20,852 4-12-2020) (19,180 4-11-2020 ) (17,887 4-10-2020) (16,422 4-9-2020) (15,078 4-8-2020) (13,549 4-7-2020) (12,262 4-6-2020) (11,256 4-5-2020) (10,357 4/4/2020) (8,904-- 4/3/2020) (7,695-- 4/2/2020)   (6,980-- 4/1/2020) (5,994-- 3/31/2020)  (5,05--7 3/30/2020) (4,596-- 3/29/2020)


    Deaths

    (2662 5-4-2020) (2,618 5-3-2020) (2,559 5-2-2020) (2,457 5-1-2020) (2,355  4-30-2020) (2,215  4-29-2020)  (2,125  4-28-2020) (1,983  4-27-2020) (1,933 4-26-2020 )(1,874  4-25-2020) 1,795  4-22-2020) (1,688  2-23-2020) (1,585 4-22-2020) (1,468  4-21-2020) (1,349 4-20-2020)(1,290 4-18-2020)  (1,259  4-18-2020) (1,134  4-17-2020) (1,072  4-16-2020) (948 4-15-2020)  (866 4-14-2020) (794 4-13-2020)  (720 4-12-2020) (677 4-11-2020)(596 4-10-2020) (528 4-9-2020) (462 4-8-2020) (380 4-7-2020)(307 4-6-2020) (274 4-5-2020) (243—4-4-2020) (210-- 4-3-2020) (157 4-2-2020)(141 4/1/2020) (99 3/31/2020) (73 3/30/2020)  (65 3/29/2020)
    Total Persons Tested*
    (333,147  5-4-2020) (319,313  5-3-2020) (299,892 5-2-2020)  (284,688  5-1-2020) (269,867 4-30-2020) (256,667  4-29-2020) (242,189  4-28-2020) (227,628  4-27-2020) (214,952 4-26-2020) (201,617 4-25-2020) (186,219  4-24-2020)(173,316 4-23-2020) (164,346 4-22-2020)  (154,997  4-21-2020) (148,358 4-20-2020) (143,318 4-19-2020)  (137,404  4-18-2020) (130,163  4-17-2020)  (122,589  4-16-2020)  (116,929 4-15-2020) (110,616 4-14-2020)  (105,768 4-13-2020) (100,735 4-12-2020) (92,779 4-11-2020) (87,527 4-10-2020) (86,857 4-9-2020) (75,066 4-8-2020) (68,732 4-7-2020) (62,942 4-6-2020) (58,983 4-5-2020) (53,581—4-4-2020)  (48,048-- 4-3-2020) (43,653-- 4/2/2020) (40,384-- 4/1/2020) (35,225-- 3-31-2020) (30,446-- 3/30/2020)  (27,762-- 3/29/2020)

    *Total number of people reported electronically for testing of COVID-19 at IDPH, commercial or hospital laboratories. Deaths are included in the number of positive cases
    All numbers displayed are provisional and subject to change.

    Information to be updated daily.

    Above is from: http://www.dph.illinois.gov/covid19/covid19-statistics

    *****************************************************************************************************************************

    Home


    PROJECTIONS from:  http://www.healthdata.org/research-article/forecasting-covid-19-impact-hospital-bed-days-icu-days-ventilator-days-and-deaths Now being updated three times per week.

    HUGE INCREASE IN PROJECTED DEATHS    For discussion go to:  http://boonecountywatchdog.blogspot.com/2020/05/ihme-model-nearly-doubles-death.html

    Total COVID-19 deaths projected through August 4, 2020 in Illinois (6,353  5-4-2020)  (2,337  4-29-2020)   (2,316 4-27-2020)  (2093 4-21-2020) (2,259 4-15-2020) (1248 4-13-2020)

    (777 4-10-2020)  (1,584  4-8-2020) (3,629 4-5-2020)(3,386 4-2-2020) (2,789 4-1-2020)  (2,326  3-31-2020)  (2,369 as of 3/30/2020)  (2,454 AS OF 3-26-2020)

    COVID-19 deaths   Peak deaths  (95 deaths on 4-19-2020)               Previously (91 deaths on 4-12-2020)  (208 on 4-12-2020) (109 on 4-20-2020)

    Illinois Population:  12.74 million        Projected deaths per million: 498,67

    For a lengthier discussion of the projection model go to:  http://boonecountywatchdog.blogspot.com/2020/03/forecasting-covid-19-impact-on-hospital.html and http://boonecountywatchdog.blogspot.com/2020/05/why-imhs-corvid-19-model-is-so-wrong.html

    BOONE COUNTY


    **************************************************************************************************************************************************************

    This page summarizes the latest data for COVID-19 in McHenry County. This data is provisional and subject to change.

    McHenry County

    McHenry County Cases


    McHenry County Cases


    798

    Source: McHenry County Department of Health

    McHenry County Deaths


    42

    Source: McHenry County Department of Health


    Above is from:  https://mchenry-county-coronavirus-response-mchenrycountygis.hub.arcgis.com/

    *************************************************************************************************************************************************************************

    By WIFR Newsroom |

    Posted: Mon 4:02 PM, May 04, 2020  |

    Updated: Mon 4:38 PM, May 04, 2020

    WINNEBAGO COUNTY, Ill. (WIFR) -- At the Monday COVID-19 press briefing, county health officials announced more positive cases and more tests have been completed.

    According to Dr. Sandra Martell of the Winnebago County Health Department, she says that 6,900 tests have been administered so far in the county for COVID-19. 16.2% of the tests have come back positive. 3,162 tests have come back negative and 3,107 tests are still pending.

    54 new cases were also announced by health officials, bringing the county total to 616 positive cases. 2/3 of the confirmed cases in Winnebago County, Martell says, come from 'areas of concern' in the county.

    Areas of concern are the following:

    -- Alden Alma Nelson Manor
    -- Amberwood Care Centre
    -- Anam Care
    -- East Bank Center
    -- Forest City Rehab & Nursing
    -- Goldie B Floberg Center
    -- Milestone
    -- Peterson Meadows
    -- River Bluff Nursing Home
    -- Rockford Rescue Mission
    -- Van Matre
    -- Winnebago County Jail

    Location of concerns can be removed off the list after 0 new cases in 28 days, said Dr. Martell.

    1 new death was announced over the last 24 hours, the total now at 22.

    Here is the breakdown of cases in the county by age group:

    -- 24 cases: 0-9 age group
    -- 37 cases: 10-19 age group
    -- 127 cases: 20-29 age group
    -- 119 cases: 30-39 age group
    -- 96 cases: 40-49 age group
    -- 99 cases: 50-59 age group
    -- 62 cases: 60-69 age group
    -- 27 cases: 70-79 age group
    -- 25 cases: 80 and older age group

    Here is the breakdown of the cases in the county by race ethnicity:

    -- 23%: White. Not Hispanic or Latino
    -- 22%: Black/African American, Not Hispanic or Latino
    -- 15%: Hispanic or Latino
    -- 3%: Asian, Not Hispanic
    -- 37%: Unknown

    The health department also reports that 107 people have recovered from the novel coronavirus, up 6 from yesterday.

    Dr. Martell also emphasized that the most cases of confirmed COVID-19 cases are in the 20-29 age group saying the group is, "the one inching to get out each day."

    Above is from:  https://www.wifr.com/content/news/Winnebago-County-announces-54-new-COVID-19-cases-total-surpasses-600.html


    **********************************************************************************************************************************************

    Cases in U.S.

    Updated  May 4, 2020
    U.S. At A Glance

    As of May 3, 2020

    Total Cases*

    1,152,372

    Total Deaths

    67,456   This page will be updated daily. Numbers close out at 4 p.m. the day before reporting.

    ***On Saturday and Sunday, the numbers in COVID-19: U.S. at a Glance and the figure describing the cumulative total number of COVID-19 cases in the United States will be updated. These numbers are preliminary and have not been confirmed by state and territorial health departments. CDC will update weekend numbers the following Monday to reflect health department updates.***

    CDC is responding to an outbreak of respiratory illness caused by a novel (new) coronavirus. The outbreak first started in Wuhan, China, but cases have been identified in a growing number of other locations internationally, including the United States. In addition to CDC, many public health laboratories are now testing for the virus that causes COVID-19.

    COVID-19: U.S. at a Glance*†

    • Total cases (1,152,372 5-4-2020 )(1,092,815 5-2-2020)   (1,062,446  5-1-2020)(1,031,659  4-30-2020)  (1,005,147  4-28-2020) (957,875  4-27-2020) (928,619  4-26-2020)  (895,766  4-25-2020)   (865,585 4-24-2020)   (829,441   4-23-2020) (802,583  4-22-2020) (776,093 4-21-2020) (746,625 4-20-2020) (720,630 4-19-2020)  (661,712 4-17-2020)  (632,548 4-16-2020)  (605,390 4-15-2020) (579,005 4-14-2020)  (554,849 4-13-2020) (525,704 4-12-2020)  (492,416 4-11-2020)(459,165 4-10-2020) (427,460 4-9-2020) (395,011 4-8-2020)(374,329 4-7-2020) (330,891 4-6-2020) (304,826 4-5-2020) (277,205 4-4-2020) (239,279 4-3-2020) (213,144 4/2/2020)(186,101 4/1/2020) (163,539 3/31/2020) (140,904 3/30/2020)   (122,653  3-29-2020)
    • Total deaths (67,456  5-4-2020)  (64,283  5-2-2020)  (62,405 5-1-2020)  (60,057  4-30-2020) (57,505  4-28-2020)  (53,922 4-27-2020) (52,459  4-26-2020)  (50,439 4-25-2020) (48,816  4-24-2020) (46,379 4-23-2020) (44,575 4-22-2020)  (41,759 4-21-2020) (39,083 4-20-2020)  (37,202 4-19-2020)  (33,049 4-17-2020)  (31,071 4-16-2020) (24,582 4-15-2020) (22,252 4-14-2020) (21,942 4-13-2020)  (20,486 4-12-2020)  (18,559 4-11-2020) (16,570 4-10-2020) (14,696 4-9-2020) (12,754 4-8-2020) (12,064 4-7-2020) (8,910 4-6-2020)(7,616 4-5-2020)  (6, 593 4-4-2020) (5,443 4-3-2020) (4,513 4-2-2020) (3,603 4-1-2020) (2,860 3/31/2020) (2,405 3/30/2020)   (2,112  3-29-2020)
    • Jurisdictions reporting cases: 55 (50 states, District of Columbia, Puerto Rico, Guam, Northern Marianas, and US Virgin Islands)

    * Data include both confirmed and presumptive positive cases of COVID-19 reported to CDC or tested at CDC since January 21, 2020, with the exception of testing results for persons repatriated to the United States from Wuhan, China and Japan. State and local public health departments are now testing and publicly reporting their cases. In the event of a discrepancy between CDC cases and cases reported by state and local public health officials, data reported by states should be considered the most up to date.

    † Numbers updated Saturday and Sunday are not confirmed by state and territorial health departments. These numbers will be modified when numbers are updated on Monday.(

    Cases of COVID-19 Reported in the US, by Source of Exposure*†

    * Data include both confirmed and presumptive positive cases of COVID-19 reported to CDC or tested at CDC since January 21, 2020, with the exception of testing results for persons repatriated to the United States from Wuhan, China and Japan. State and local public health departments are now testing and publicly reporting their cases. In the event of a discrepancy between CDC cases and cases reported by state and local public health officials, data reported by states should be considered the most up to date.

    † CDC is no longer reporting the number of persons under investigation (PUIs) that have been tested, as well as PUIs that have tested negative. Now that states are testing and reporting their own results, CDC’s numbers are not representative of all testing being done nationwide.

    Above is from:  https://www.cdc.gov/coronavirus/2019-ncov/cases-updates/cases-in-us.html

    ***************************************************************************************************************************************

    Now being updated three times per week.

    HUGE INCREASE IN PROJECTED DEATHS    For discussion go to:  http://boonecountywatchdog.blogspot.com/2020/05/ihme-model-nearly-doubles-death.html

    PROJECTIONS:   US COVID-19 Deaths thru 8-4-2020) (134,475  5-4-2020)  (72,433   4-29-2020)  (74,073 4-27-2020) (65,976 4-21-2020)  (60,308 4-15-2020) (68,841 4-13-2020)  (61,543 4-10-2020) (60,415 4-8-2020) (81,766 4-5-2020) (93,531 4/3/2020) (93,765 4/1/2020)   (83.967 3/31/2020)    ( 82,141 3/30/2020);  Peak Daily    (2150 4-13-2020)

    Older Peak Daily Deaths (2,212 on 4-12-2010)  (1,983 on 4-11-2020)  (2,644 on 4-16-2020)(3,130 on 4-16-2020) ( 2214 on 3/31/2020) (2,214 on 3/31/2 020) (2,271 3/30/2020)

    US Population:  331 million    Projected deaths per million: 406.27

    FROM:  http://www.healthdata.org/research-article/forecasting-covid-19-impact-hospital-bed-days-icu-days-ventilator-days-and-deaths Now being updated three times per week

    *********************************************************************************************************************************************

    COVID-19 Tracker   Great site to find specific county, state, country numbers is at:  https://bing.com/covid?form=msntrk  Site supplies case numbers, recovered cases and deaths by country and US state.

    World population: 7.8  BILLION

    Total confirmed cases

    Updated 8 min ago

    3,578,301

    Active cases

    2,164,963

    +38,023

    Recovered cases

    1,162,279

    +38,152

    Fatal cases

    251,059

    +3,952