Great forecasting model for US and individual states. It is updated daily. Click on following to find current data: http://www.healthdata.org/research-article/forecasting-covid-19-impact-hospital-bed-days-icu-days-ventilator-days-and-deaths
Forecasting COVID-19 impact on hospital bed-days, ICU-days, ventilator days and deaths by US state in the next 4 months
Publication date:
March 26, 2020
View the COVID-19 US projections data visualization
IMPORTANCE
This study presents the first set of estimates of predicted health service utilization and deaths due to COVID-19 by day for the next 4 months for each state in the US.
OBJECTIVE
To determine the extent and timing of deaths and excess demand for hospital services due to COVID-19 in the US.
DESIGN, SETTING, AND PARTICIPANTS
This study used data on confirmed COVID-19 deaths by day from WHO websites and local and national governments; data on hospital capacity and utilization for US states; and observed COVID-19 utilization data from select locations to develop a statistical model forecasting deaths and hospital utilization against capacity by state for the US over the next 4 months.
EXPOSURE(S)
COVID-19.
MAIN OUTCOME(S) AND MEASURE(S)
Deaths, bed and ICU occupancy, and ventilator use.
RESULTS
Compared to licensed capacity and average annual occupancy rates, excess demand from COVID-19 at the peak of the pandemic in the second week of April is predicted to be 64,175 (95% UI 7,977 to 251,059) total beds and 17,309 (95% UI 2,432 to 57,584) ICU beds. At the peak of the pandemic, ventilator use is predicted to be 19,481 (95% UI 9,767 to 39,674). The date of peak excess demand by state varies from the second week of April through May. We estimate that there will be a total of 81,114 deaths (95% UI 38,242 to 162,106) from COVID-19 over the next 4 months in the US. Deaths from COVID-19 are estimated to drop below 10 deaths per day between May 31 and June 6.
CONCLUSIONS AND RELEVANCE
In addition to a large number of deaths from COVID-19, the epidemic in the US will place a load well beyond the current capacity of hospitals to manage, especially for ICU care. These estimates can help inform the development and implementation of strategies to mitigate this gap, including reducing non-COVID-19 demand for services and temporarily increasing system capacity. These are urgently needed given that peak volumes are estimated to be only three weeks away. The estimated excess demand on hospital systems is predicated on the enactment of social distancing measures in all states that have not done so already within the next week and maintenance of these measures throughout the epidemic, emphasizing the importance of implementing, enforcing, and maintaining these measures to mitigate hospital system overload and prevent deaths.
Citation:
IHME COVID-19 health service utilization forecasting team. Forecasting COVID-19 impact on hospital bed-days, ICU-days, ventilator days and deaths by US state in the next 4 months. MedRxiv. 26 March 2020. doi:
Related Content
Data visualizations

COVID-19 US STATE-BY-STATE PROJECTIONS
IHME’s COVID-19 projections were developed in response to requests from the University of Washington School of Medicine and other US hospital systems and state governments working to ...
******************************************************************************************************************************************
Below is a commentary on the University of Washington study by Rich Miller of Capitol Fax.
A look at that University of Washington COVID-19 study and how Illinois fares
Sunday, Mar 29, 2020
* A new study by the University of Washington’s Institute for Health Metrics and Evaluation is quite sobering. Let’s start with the press release…
In a forecast based on new data analyses, researchers find demand for ventilators and beds in US hospital intensive care units (ICUs) will far exceed capacity for COVID-19 patients as early as the second week of April. Deaths related to the current wave of COVID-19 in the US are likely to persist into July, even assuming people protect themselves and their communities by strongly adhering to social distancing measures and by taking other precautions advised by public health officials.
The study uses a range of outcomes with a 95 percent uncertainty (or confidence) interval (UI). This produces a lower- and upper-bound estimate. The result should appear between those two bounds in 95 out of 100 simulations. This a very tricky thing to model, as they state in their methods section…
Uncertainty in the model estimates is driven by two components: (1) uncertainty from fixed effect estimation and (2) uncertainty from random effects, with the latter dominant because of the high variation between locations.
That “variation between locations” also applies to individual states. So far, though, their numbers are holding up.
* Deaths per day. The study projects the United States will hit its peak of deaths per day on April 14th at 2,341, (or between 1,149 and 4,844 at 95% UI). The study projected 437 national deaths for March 28 (with a range between 380 and 508). The actual number on the 28th was 447, so that’s well within the expected range.
You can also look at the numbers by state. Illinois is expected to hit 91 deaths per day at its peak on April 17th, (or between 18 and 177 at 95% UI). The study projected 11 deaths per day for Illinois by March 28, (or between 6 and 17). Illinois reported 13 deaths yesterday.
According to the projection, Illinois will not return to yesterday’s death level until around May 11th. But it could come earlier (late April) considering the projected range, or later (beginning of June). You can clearly see the difficulty here in predicting when Illinois should lift its stay at home order.
* Cumulative deaths. By March 28, the study had forecast 1,979 cumulative deaths in the US, a number derived from a range of 1,842 to 2,137. The actual total was 2,038. That’s well within the expected range.
For Illinois, the study projected 47 cumulative deaths by March 28, (or between 34 and 63). The actual number was 47.
Point being, each day’s projected number won’t be exactly right, but it will likely be in the expected ballpark over time at a 95 percent UI. Its projection for New York of 722 deaths by March 28 was also pretty spot on. New York reported 728 deaths as of that day.
* In all, the study projects 81,114 total deaths in the United States by July 15th, (or between 38,242 and 162,106). Things start to level off around the first week of June or thereabouts.
Illinois can expect to experience 2,453 deaths by June 4, (or between 507 and 5,850). As noted above, Illinois is projected to start leveling off in earlyish May or so.
* Peak resource use. The study projects peak resources will be needed in the nation as a whole by April 14th. By that point, the nation will be short 49,292 hospital beds and 14,601 ICU beds and 18,767 ventilators will be needed (the researchers could not estimate existing ventilator capacity). But because this is such a large country and the trajectories are different for various regions, let’s focus on Illinois.
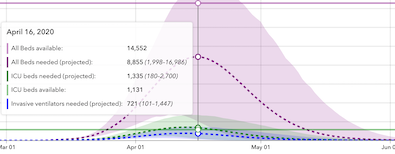
Illinois will hit its peak resource day on April 16. We should have 14,552 hospital beds available by that day. The study projects we’ll need 8,885. So, we’re good, right? Well, that number is derived from a range of 1,998 to 16,986, so don’t get too comfortable. Also - and this is very, very important - Illinois is a big and diverse state. Some hospitals may have excess capacity while several may not. It could be a real nightmare for some areas and/or individual hospitals.
Also, just because we have bed capacity doesn’t mean that hospitals have enough gloves, masks, etc. And, partly because of the national PPE and testing shortages and lack of a vaccine, hospital/ambulance/first responder staffing levels could crash as more and more workers contract the virus.
And then there’s the ICU bed issue. Illinois will have 1,131 ICU beds available on April 16, but it will need 1,335, or 204 more than existing capacity (the projected ICU bed range need is between 180 and 2,700). That obviously needs to be addressed, particularly when you factor in any regional disparity.
We’ll also need 721 ventilators by that time, but the expected range could push that number as high as 1,447.
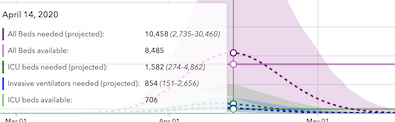
Indiana is in much worse shape. They’ll need an additional 1,973 hospital beds, 876 ICU beds and 854 ventilators. Missouri’s is even worse. Michigan is about to get clobbered. By April 8th, that state is projected to need 10,563 additional hospital beds, 2,564 ICU beds and 1,785 ventilators. New York is a disaster. By April 6th it’s projected to need 35,301 more hospital beds than it had, 6,949 ICU beds and 4,141 ventilators.
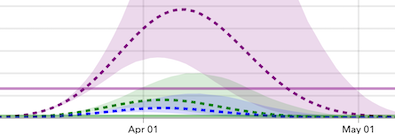
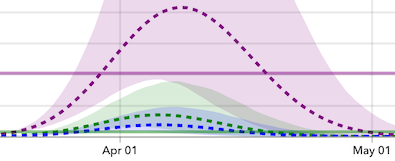
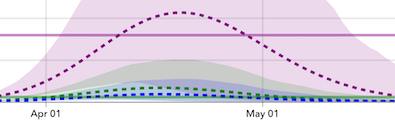
* Now, on to some visuals. When you hear people say “flatten the curve,” it means we have to keep the following graph’s curving purple dotted line (hospital beds needed) beneath that straight solid purple line (existing hospital beds available). Same goes for needed and existing ICU beds with the green dotted and straight lines. As noted above, Illinois achieves the flattening goal for hospital beds, but not for ICU beds. A shortage of existing ICU beds will begin on April 7 and last what could be two very long weeks…
Keep in mind that the feds are becoming quite concerned about a spike in Chicago and Cook. As emphasized above, some hospitals will have excess capacity while some will not.
* Indiana will not sufficiently flatten the curve. The state goes above existing hospital bed capacity on April 8th and won’t have excess beds until April 21. Existing ICU capacity is breached on March 31 and that will last through April 24…
* New York went above existing capacity days ago and won’t have available hospital beds and ICU beds until April 22nd…
* Michigan appears to already be above existing ICU capacity and will be above existing hospital bed capacity on March 30. It won’t have an excess capacity of existing ICU and hospital beds until April 19…
* Missouri will be above existing hospital bed capacity from April 12-29 and above existing ICU capacity from April 2 through May 4…
According to the projection, Wisconsin doesn’t hit peak resource needs until May 22nd, so it has time to beef up its existing ICU beds, which are projected to exceed capacity from May 4 through June 4. Ohio, like Wisconsin and Illinois, should have enough hospital beds, but it will experience an ICU bed shortage based on existing capacity from April 9-19. Minnesota will have a shortage of existing ICU beds from April 11 through May 6.
Bottom line: We’re better off than some other states, but it’s still gonna be bad. Please, stay inside.
…Adding… Fauci believes the situation will be worse than the UW study indicates…
The U.S. government’s foremost infection disease expert, Dr. Anthony Fauci, says the U.S. will certainly have “millions of cases” of COVID-19 and more than 100,000 deaths.
As the U.S. tops the world in reported infections from the new coronavirus, the director of the National Institute of Allergy and Infectious Diseases predicts 100,000-200,000 deaths from the outbreak in the U.S.
- Posted by Rich
No comments:
Post a Comment